Free Access
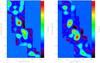
Fig. 38
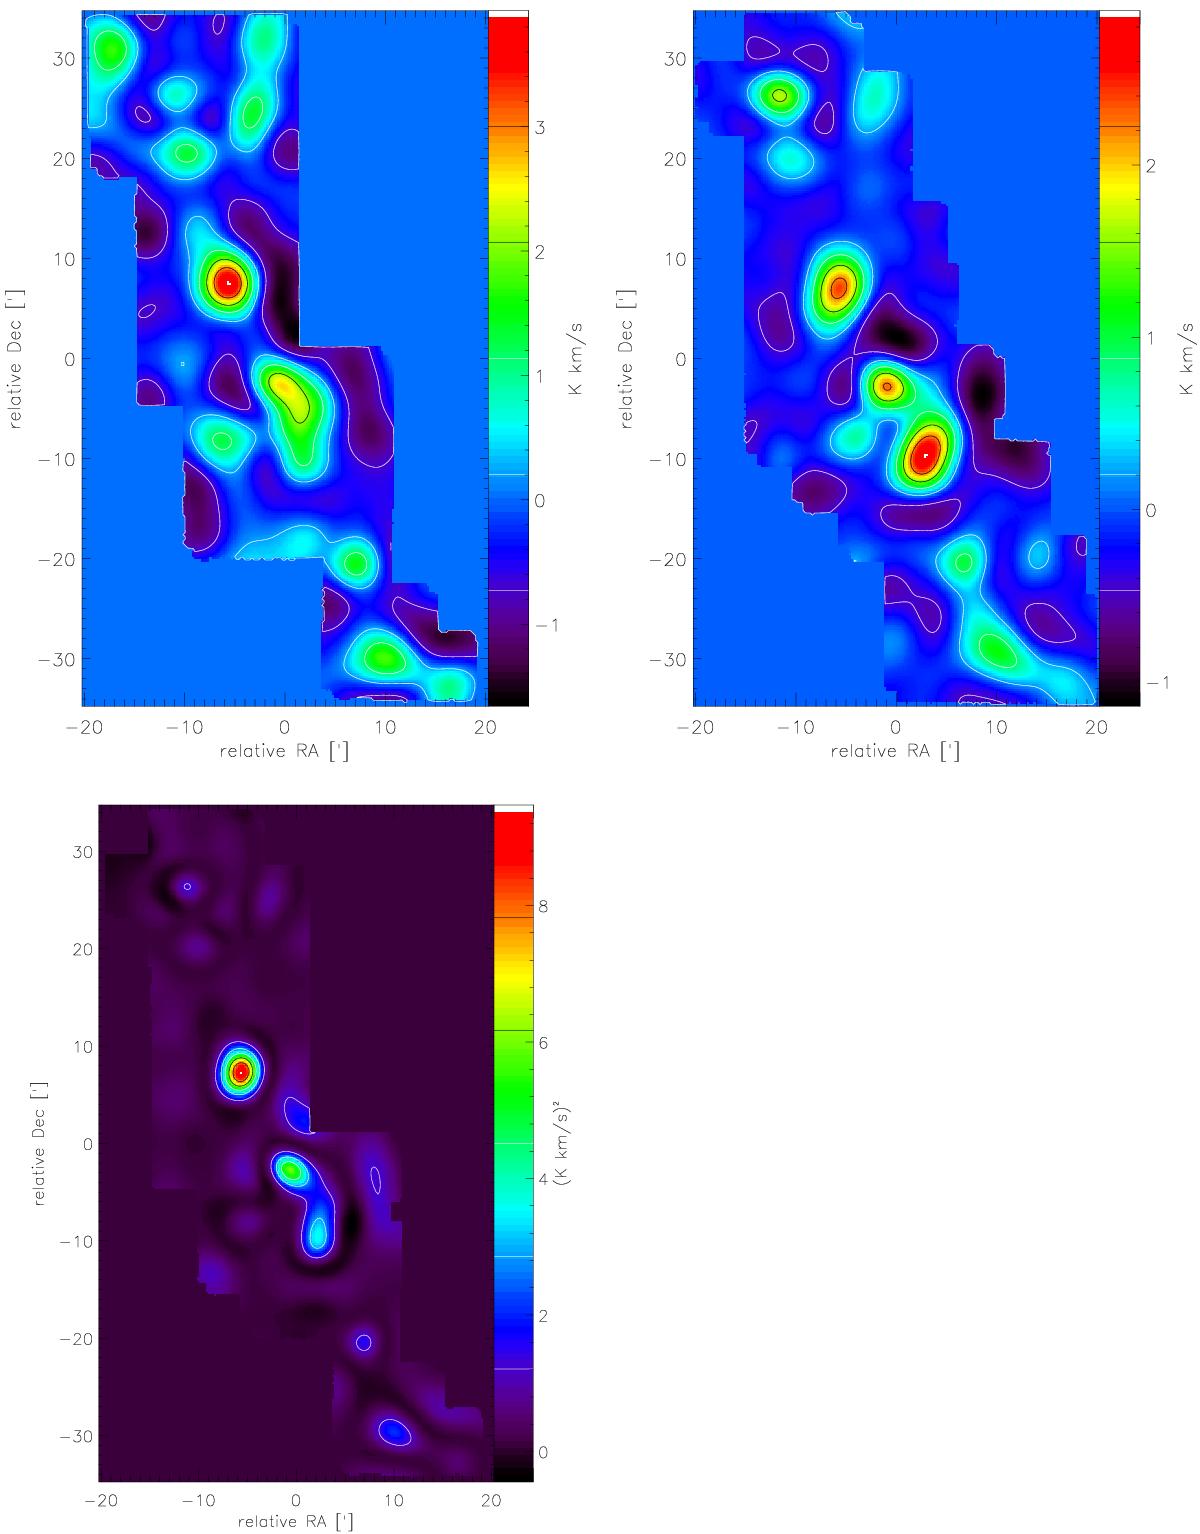
Top panels: integrated intensity maps of C18O and HCN emission lines wavelet-filtered on scale of l = 5 arcmin (left and right panels, respectively). Bottom left: product map generated by multiplying the two wavelet-filtered maps (top panels).
This figure is made of several images, please see below:
Current usage metrics show cumulative count of Article Views (full-text article views including HTML views, PDF and ePub downloads, according to the available data) and Abstracts Views on Vision4Press platform.
Data correspond to usage on the plateform after 2015. The current usage metrics is available 48-96 hours after online publication and is updated daily on week days.
Initial download of the metrics may take a while.