Fig. 33
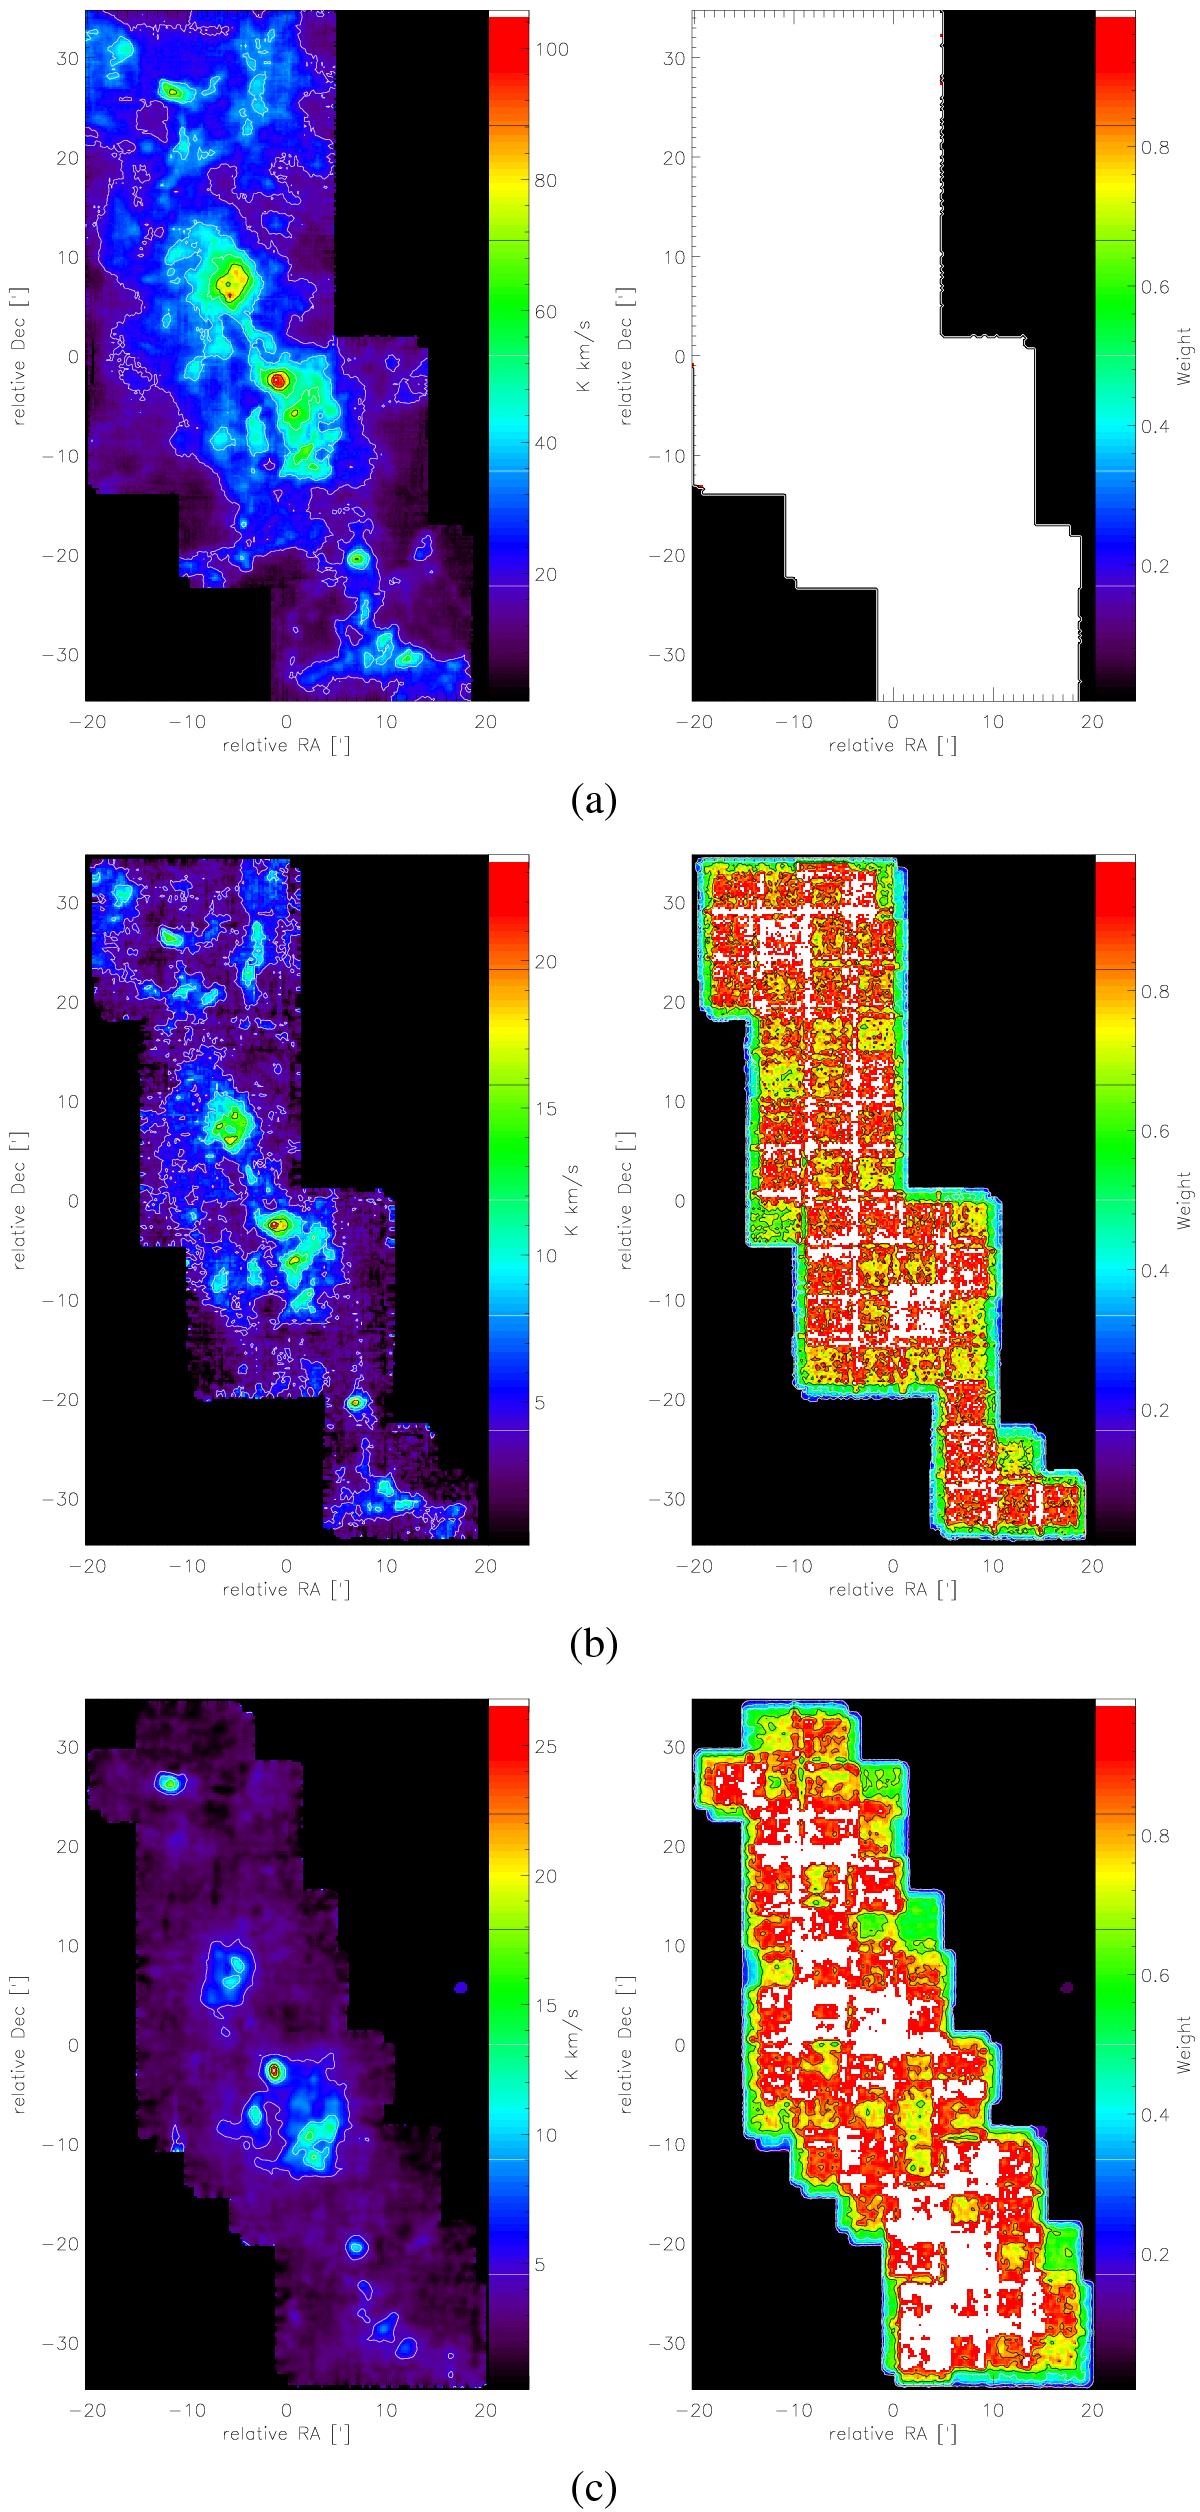
Integrated intensity maps of 13CO a), C18O b) and HCN c) emission lines of the G 333 taken by Lo et al. (2009; left panels) and significance weights w for the different points in the maps (right panels). White colour in the weight map indicates a significance of unity corresponding to a median signal-to-noise ratio of 25 or above. For the 13CO map, only pixels close to the map boundary have a lower S/N, i.e. w< 1.
Current usage metrics show cumulative count of Article Views (full-text article views including HTML views, PDF and ePub downloads, according to the available data) and Abstracts Views on Vision4Press platform.
Data correspond to usage on the plateform after 2015. The current usage metrics is available 48-96 hours after online publication and is updated daily on week days.
Initial download of the metrics may take a while.