Fig. 30
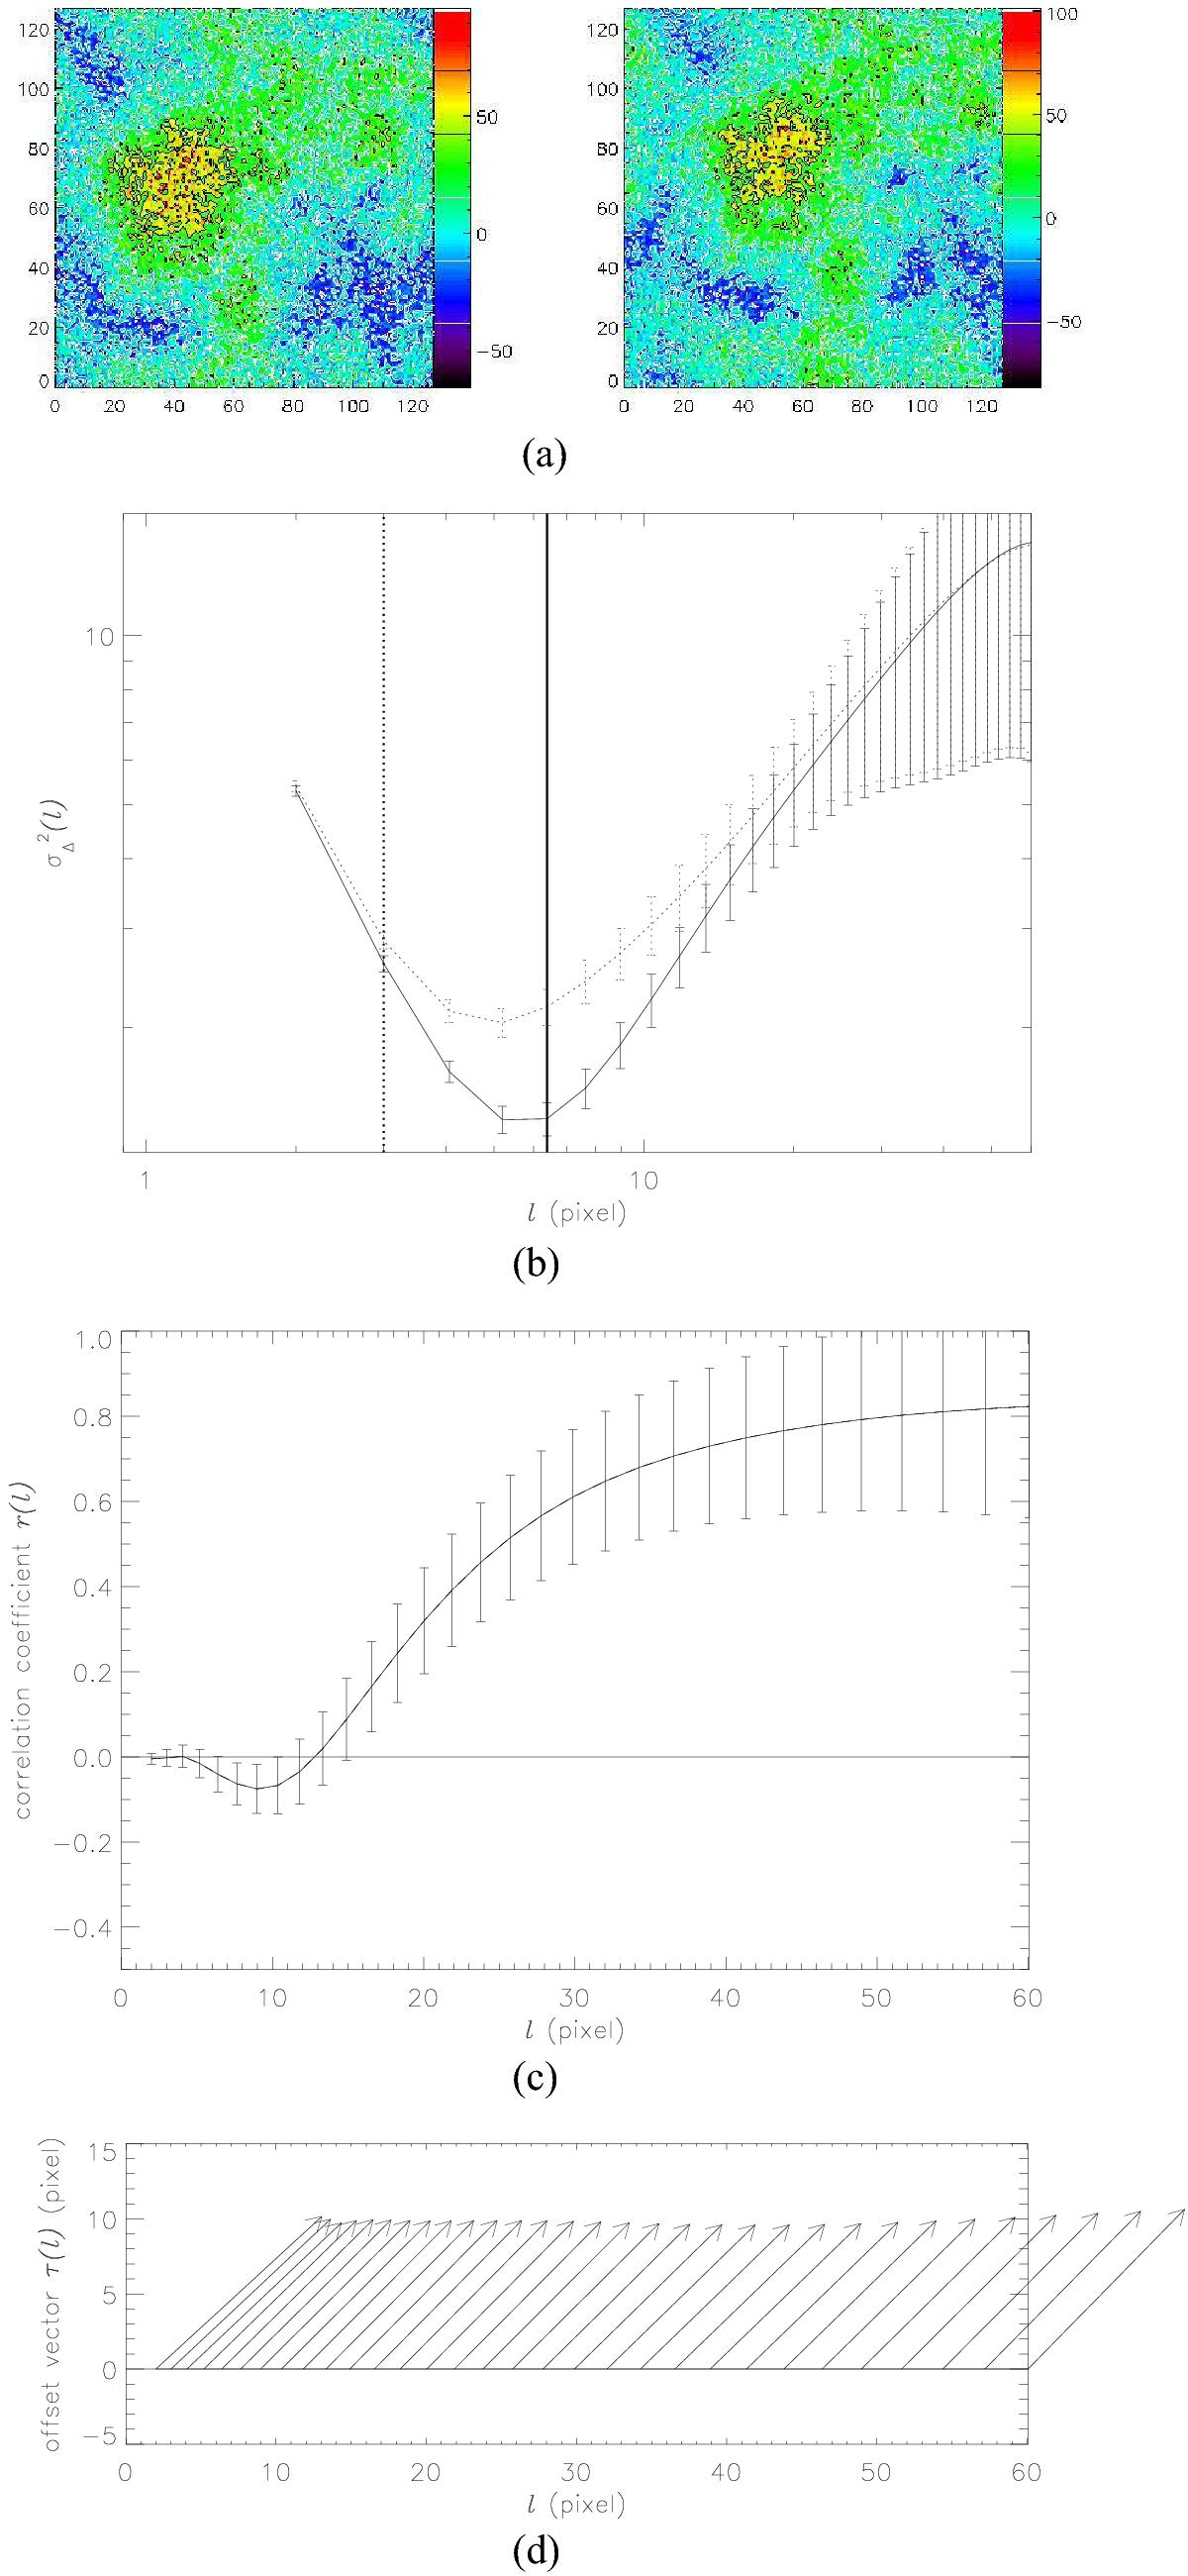
WWCC for two efBm maps (shown in a), maximum-filtered on scales of 15 pix and 5 pix) generated with a S/N = 5. The second efBm is shifted by τi = 14.1 pix (τi,x = 10 pix and τi,y = 10 pix). Part b) shows the Δ-variance spectra of the first map (full line) and the second map (dotted line) with marks of critical scales (lc = 6.4 pix and lc = 3 pix, full and dotted vertical lines, respectively) calculated from their noise-corrected spectra; c) the correlation coefficients; and d) the measured displacement vectors as a function of scale.
Current usage metrics show cumulative count of Article Views (full-text article views including HTML views, PDF and ePub downloads, according to the available data) and Abstracts Views on Vision4Press platform.
Data correspond to usage on the plateform after 2015. The current usage metrics is available 48-96 hours after online publication and is updated daily on week days.
Initial download of the metrics may take a while.