Fig. 3
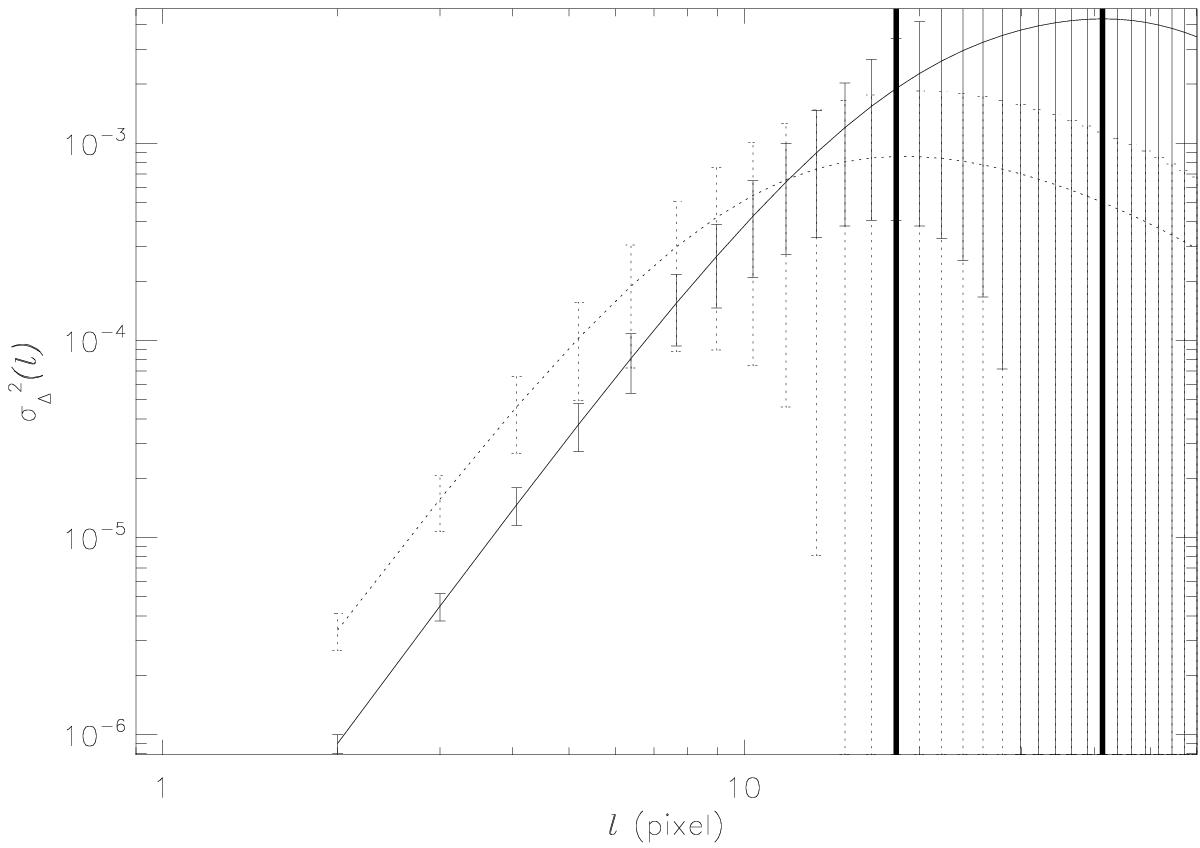
Δ-variance spectra of the two Gaussians with S/N = ∞ from Fig. 1a. The Δ-variance spectra of the large (left) and small (right) circular structures (Fig. 1a) are denoted by full and dotted lines, respectively. Vertical thick lines are used to denote the measured prominent scales of large and small circular structures, respectively.
Current usage metrics show cumulative count of Article Views (full-text article views including HTML views, PDF and ePub downloads, according to the available data) and Abstracts Views on Vision4Press platform.
Data correspond to usage on the plateform after 2015. The current usage metrics is available 48-96 hours after online publication and is updated daily on week days.
Initial download of the metrics may take a while.