Fig. 27
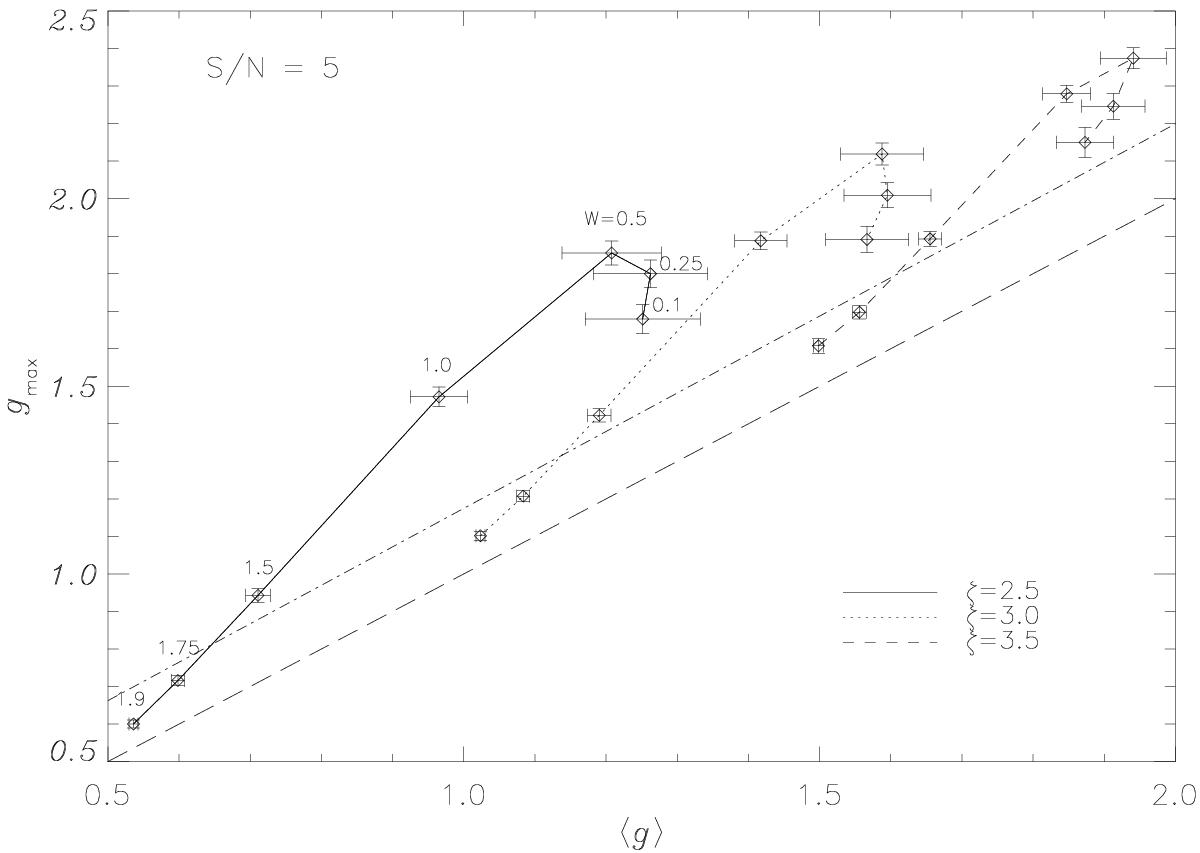
S/N = 5. Measured maximum gradient versus mean gradient for efBm maps with spectral indexes ζ = 2.5,3,3.5 (full line, dotted, and dashed lines, respectively) and different inverse brightness contrasts W = 0.1,0.25,0.5,1,1.5,1.75,1.9. The error bars indicate the standard deviation of the ensemble of ten different random realizations and seven different enhancement scales. The long-dashed line is the identity representing straight spectra, i.e. gmax = ⟨ g ⟩. The dash-dotted line represents the lower limit of gmax as a function of ⟨ g ⟩ below which the scale of the peak cannot be reliably determined (see Eq. (38)).
Current usage metrics show cumulative count of Article Views (full-text article views including HTML views, PDF and ePub downloads, according to the available data) and Abstracts Views on Vision4Press platform.
Data correspond to usage on the plateform after 2015. The current usage metrics is available 48-96 hours after online publication and is updated daily on week days.
Initial download of the metrics may take a while.