Fig. 26
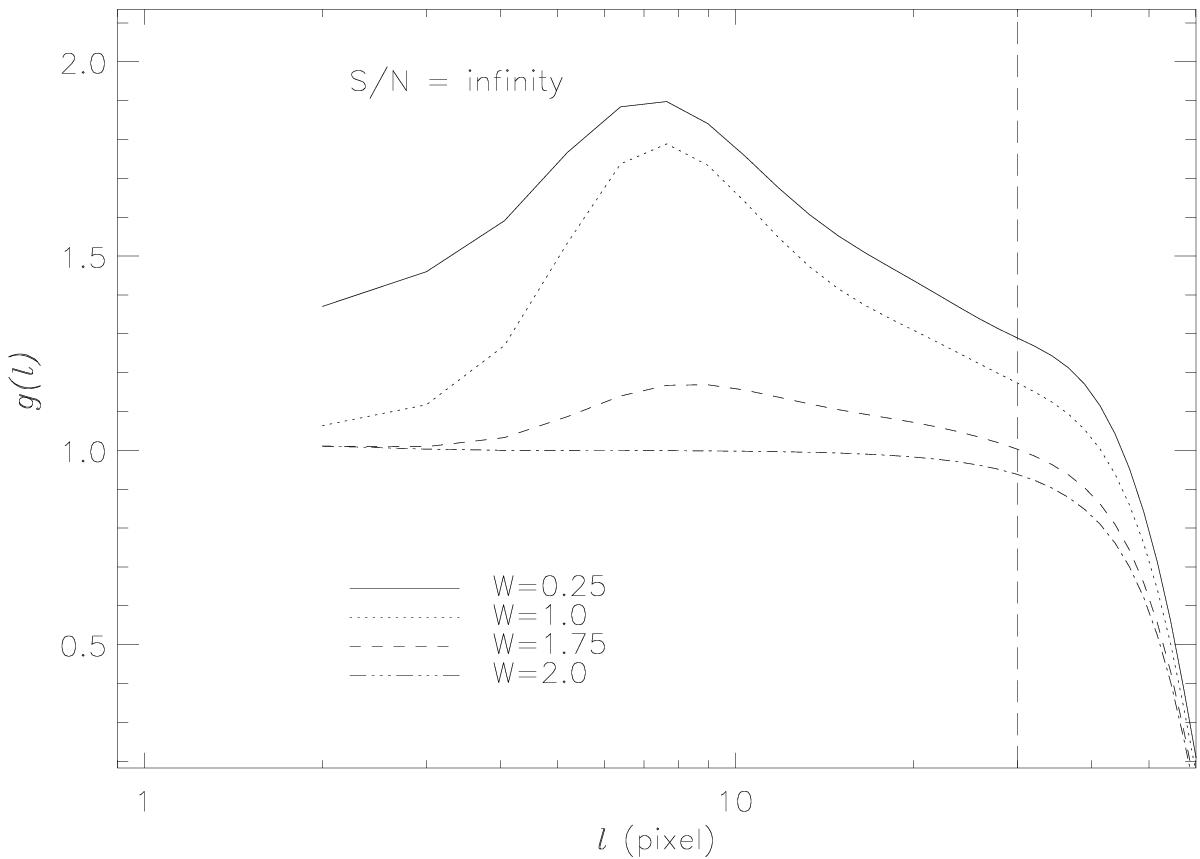
Gradient spectra of fBm maps generated with ζ = 3, S/N = ∞, enhanced on scale of lf = 15 pix and for different inverse brightness contrast parameters W = 0.25,1,1.75 and 2 (full, dotted, dashed, and dot-dashed lines, respectively). The vertical dashed line indicates the upper limit to the scale where the Δ-variance slope can be measured reliably. Above that scale, the spectrum is strongly affected by boundary effects of the assumed finite map.
Current usage metrics show cumulative count of Article Views (full-text article views including HTML views, PDF and ePub downloads, according to the available data) and Abstracts Views on Vision4Press platform.
Data correspond to usage on the plateform after 2015. The current usage metrics is available 48-96 hours after online publication and is updated daily on week days.
Initial download of the metrics may take a while.