Fig. 25
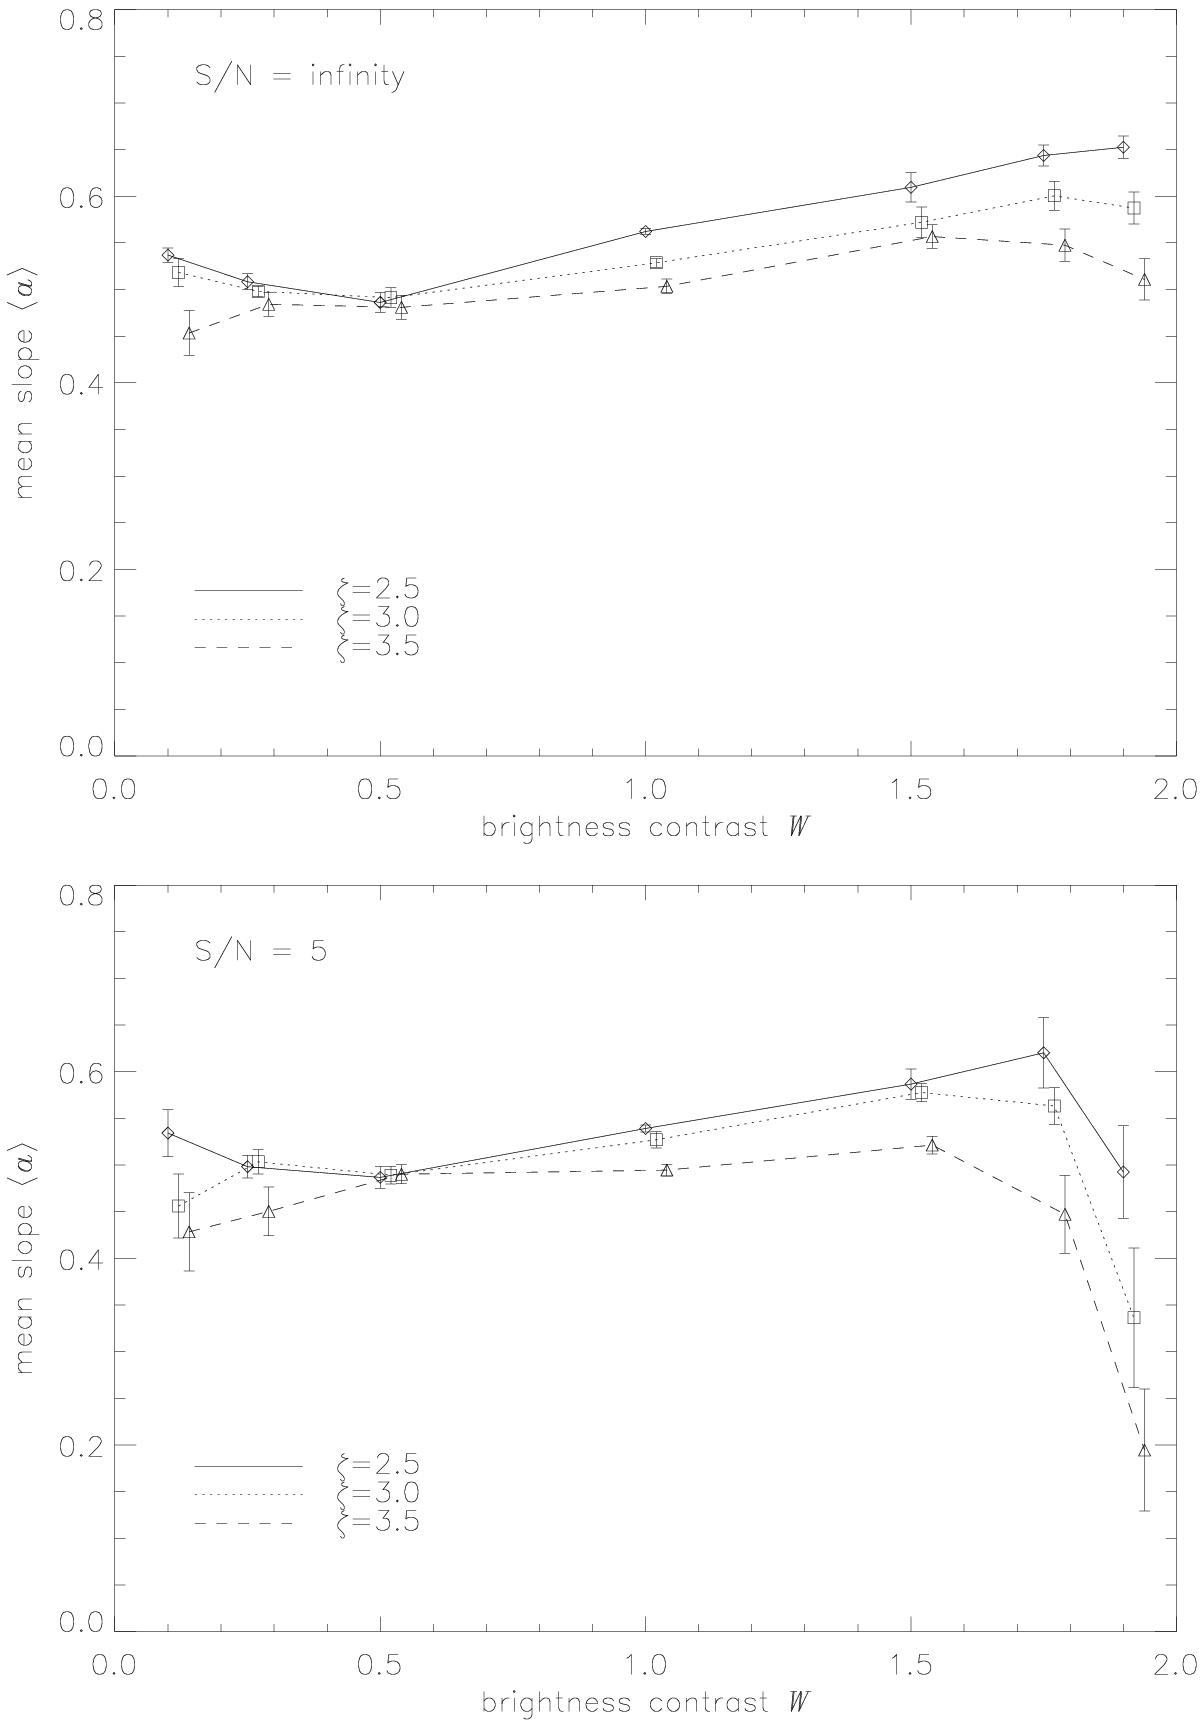
Measured slope a against inverse brightness contrast W for efBm maps with spectral indexes ζ = 2.5,3,3.5 (full, dotted, and dashed lines, respectively). Top plot: result for S/N = ∞, bottom plot: result for S/N = 5. The data points for ζ = 3 and 3.5 (squares and triangles) are horizontally displaced by W = 0.02 and W = 0.04, respectively, from the ζ = 2.5 data points (diamonds) for better visibility. The error bars represent 1 σ variations in the statistical sample.
Current usage metrics show cumulative count of Article Views (full-text article views including HTML views, PDF and ePub downloads, according to the available data) and Abstracts Views on Vision4Press platform.
Data correspond to usage on the plateform after 2015. The current usage metrics is available 48-96 hours after online publication and is updated daily on week days.
Initial download of the metrics may take a while.