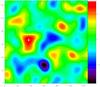
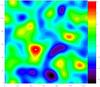
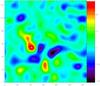
Fig. 19
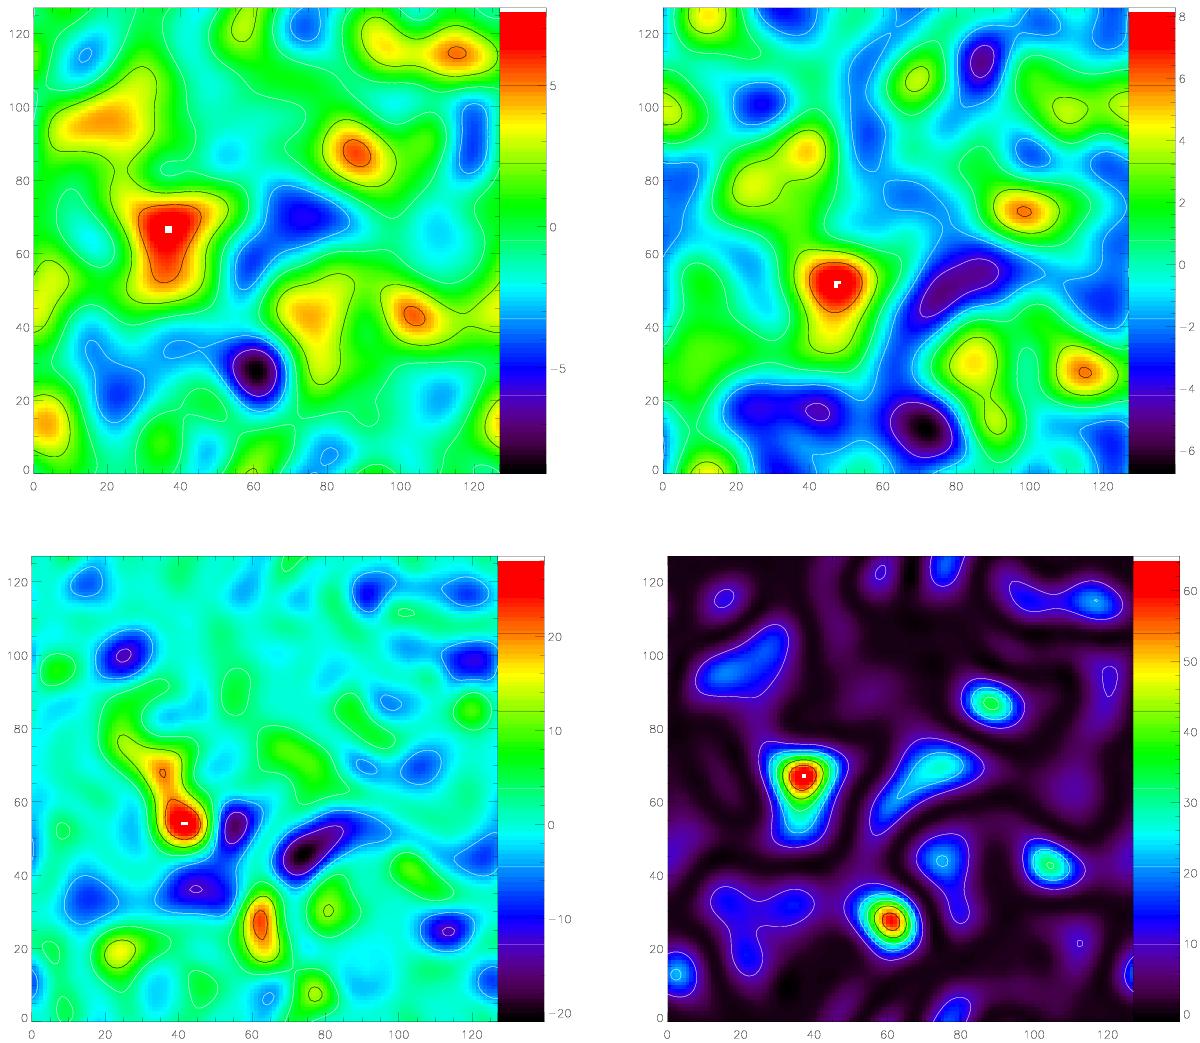
Top left: fBm map (Fig. 17a, left) filtered on scale of 17 pix. Top right: fBm map displaced on scales >10 pix by τi,x = −10 pix and τi,y = 15 pix (Fig. 17a, right) filtered on scale of 17 pix. Bottom left: product map of two fBm maps (top left and top right). Bottom right: product map of the top left and top right maps, where the latter is reversely shifted by τx = −10 pix and τy = 15 pix (Eq. (30)).
Current usage metrics show cumulative count of Article Views (full-text article views including HTML views, PDF and ePub downloads, according to the available data) and Abstracts Views on Vision4Press platform.
Data correspond to usage on the plateform after 2015. The current usage metrics is available 48-96 hours after online publication and is updated daily on week days.
Initial download of the metrics may take a while.