Fig. 8
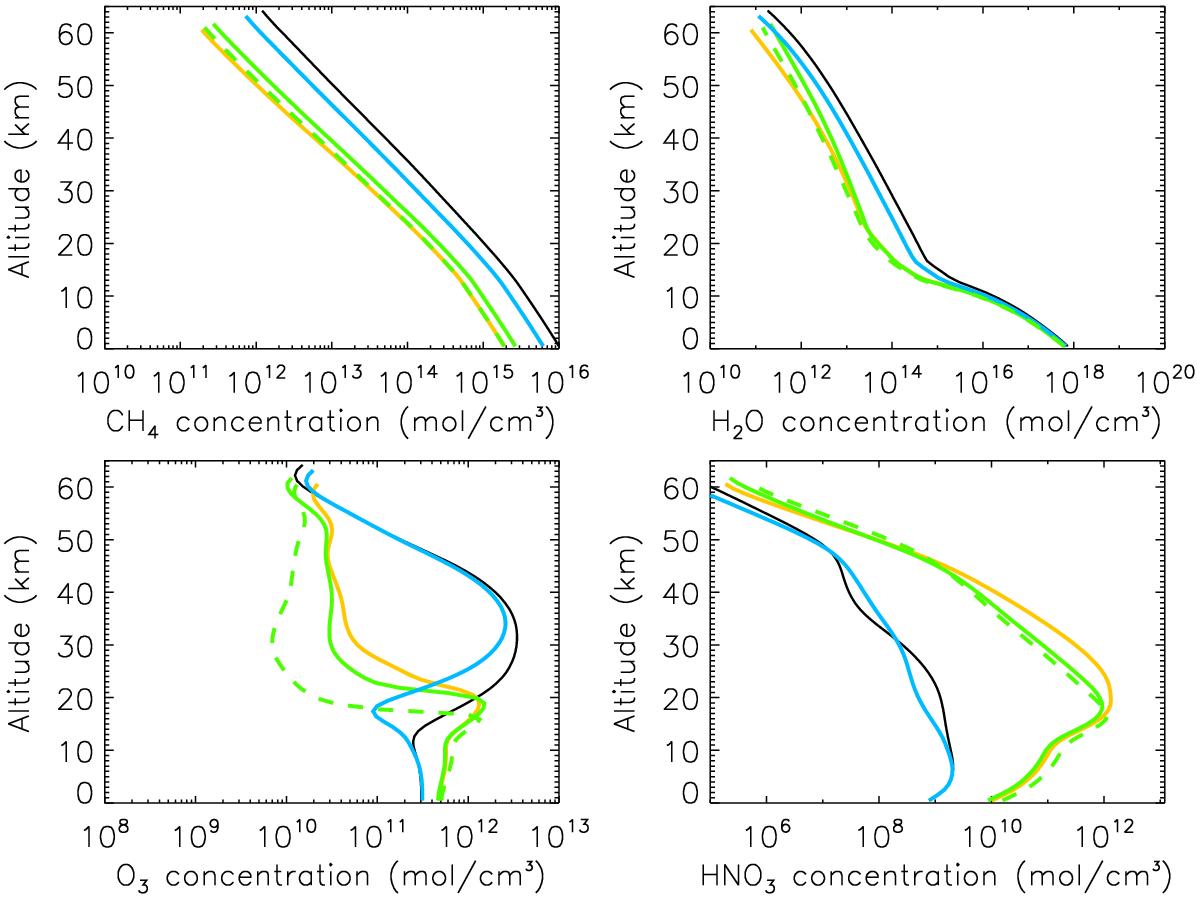
Chemical concentration profiles for species CH4, H2O, O3 and HNO3 in molecules per cm3 for scenarios 4.0−4.3 (see Sect.3.2) with the following CR-induced production mechanisms switched on: NOx+HOx (scenario 4.0, solid yellow curve), NOx (scenario 4.1, solid green curve), HOx (scenario 4.2, solid blue curve), NO (scenario 4.3, dashed green curve). Scenario 1 (M-dwarf w/o CR) is shown for comparison (solid black curve).
Current usage metrics show cumulative count of Article Views (full-text article views including HTML views, PDF and ePub downloads, according to the available data) and Abstracts Views on Vision4Press platform.
Data correspond to usage on the plateform after 2015. The current usage metrics is available 48-96 hours after online publication and is updated daily on week days.
Initial download of the metrics may take a while.