Fig. 6
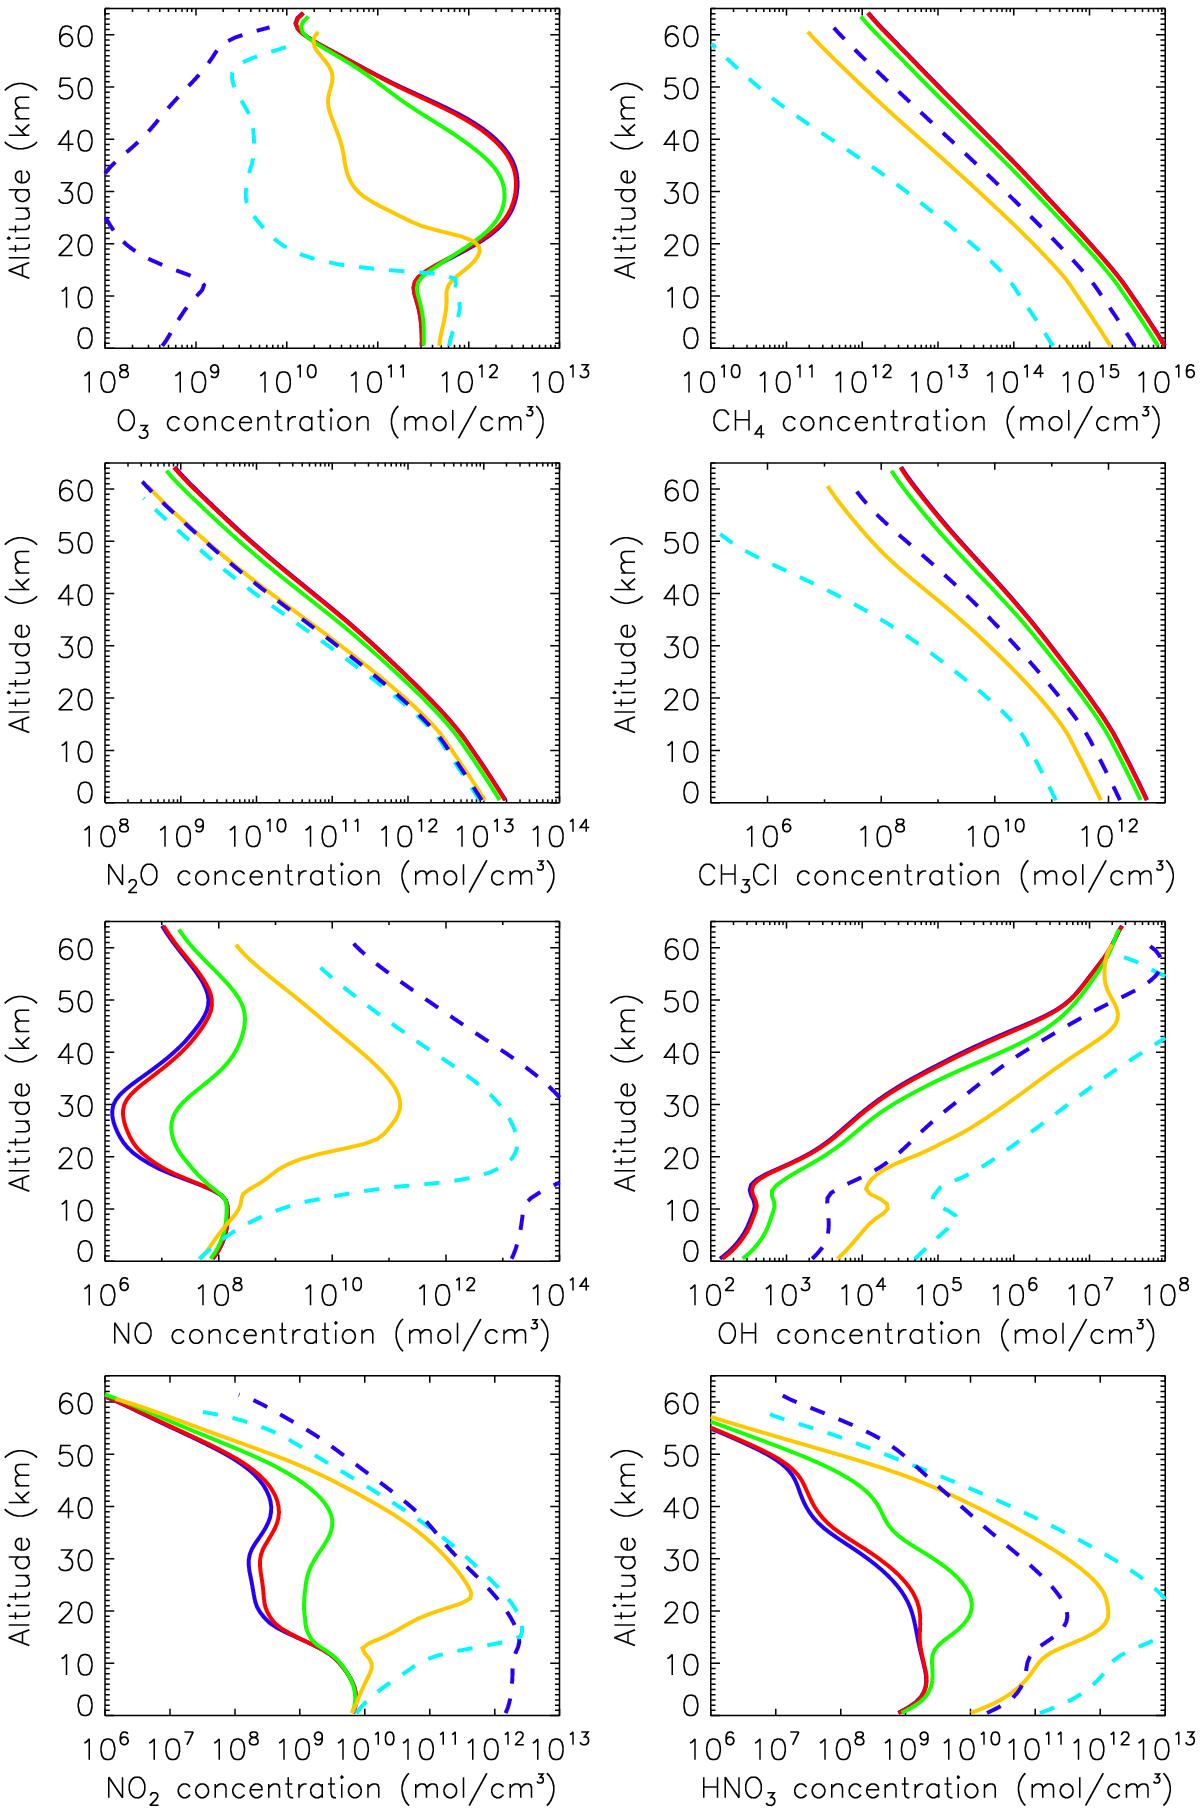
Chemical concentration profiles for biomarker species O3, CH4, N2O, and CH3Cl and for related species NO, OH, NO2, and HNO3 in molecules per cm3. Shown here are scenarios 1 through 5: M-dwarf w/o CR (solid dark blue line), quiescent M-dwarf (red line), active M-dwarf (green line), flaring M-dwarf (yellow line), flaring(x40) M-dwarf (light blue dashed line). In addition we show the result of Grenfell et al. (2012)’s flaring case (dark blue dashed line) for comparison.
Current usage metrics show cumulative count of Article Views (full-text article views including HTML views, PDF and ePub downloads, according to the available data) and Abstracts Views on Vision4Press platform.
Data correspond to usage on the plateform after 2015. The current usage metrics is available 48-96 hours after online publication and is updated daily on week days.
Initial download of the metrics may take a while.