Fig. 4
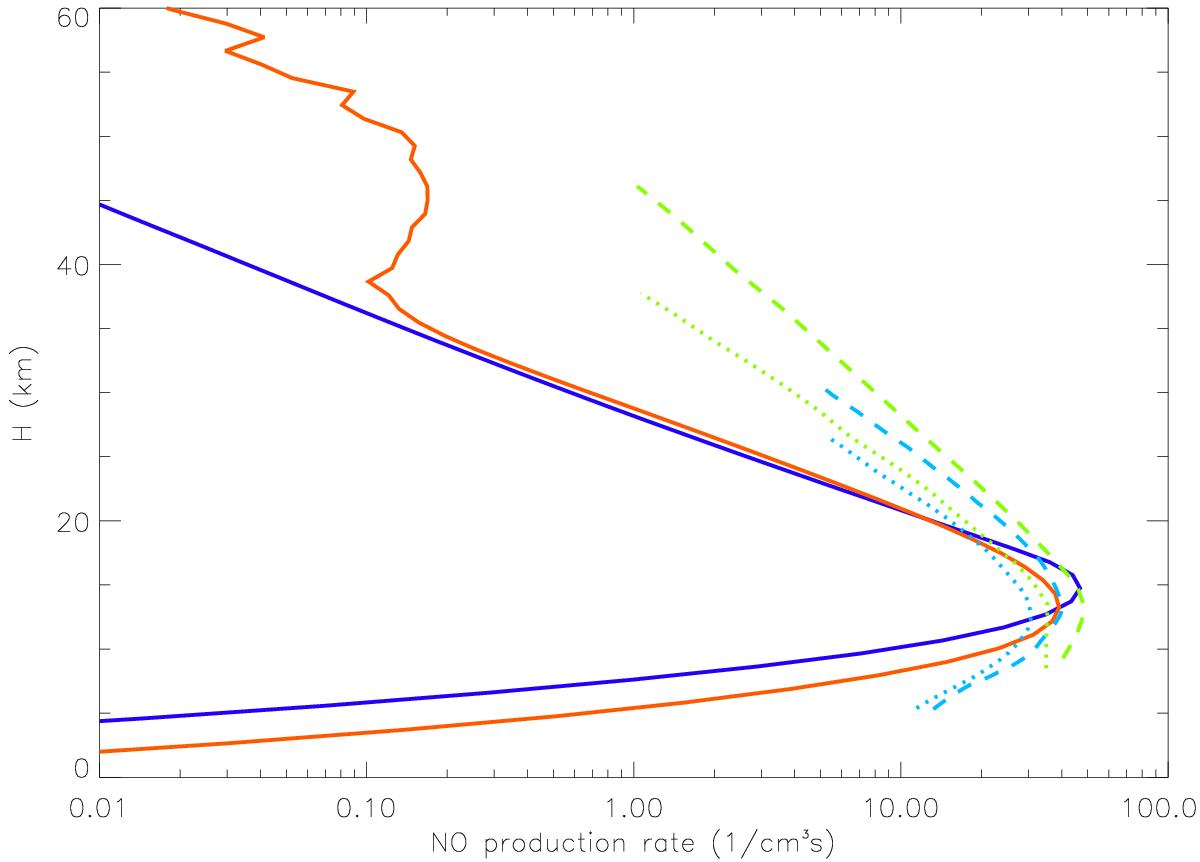
Comparison of GCR-induced NO production rates, showing model output for the original scheme (Grenfell et al. 2012,dark blue solid curve) and the new scheme (red solid curve) as well as Earth measurements from Nicolet (1975) for solar maximum (blue dotted curve) and solar minimum (blue dashed curve) and from Jackman et al. (1980) for solar maximum (green dotted curve) and solar minimum (green dashed curve).
Current usage metrics show cumulative count of Article Views (full-text article views including HTML views, PDF and ePub downloads, according to the available data) and Abstracts Views on Vision4Press platform.
Data correspond to usage on the plateform after 2015. The current usage metrics is available 48-96 hours after online publication and is updated daily on week days.
Initial download of the metrics may take a while.