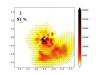
Fig. 1
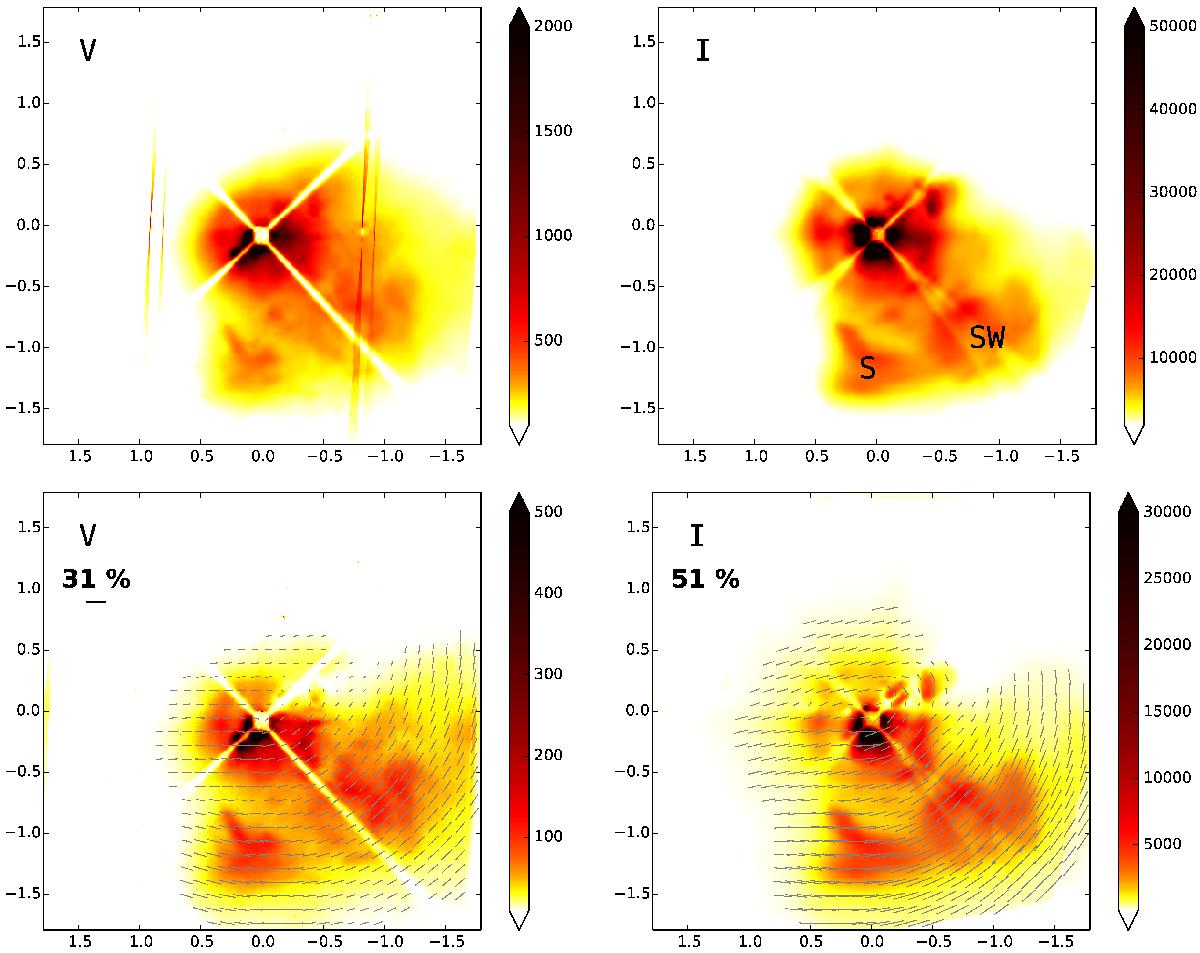
Coronagraphic imaging polarimetry of VY CMa. Top: intensity observations. Bottom: polarised intensity, with polarisation direction and fraction shown in the overlaid vector field (only shown where both the fractional polarisation and the polarised intensity are significant). Offsets from the central star are shown in arcseconds, the colour scale in arbitrary units and the observing filter in the top left corner. The contrast is noticeably higher in polarised intensity, because the stellar halo is only weakly polarised. This allows a clearer identification of circumstellar material, and separation into discrete structures. The positions of the South Knot (S) and Southwest Clump (SW) are indicated in the I-band intensity image. One arcsecond corresponds to a projected distance of approximately 200 stellar radii. The low-intensity cross is produced by the suspended coronagraphic mask, which obscures part of the image plane, while the stripe-like artefacts in the V-band image result from a detector bias effect that cancels out in the polarised signal.
Current usage metrics show cumulative count of Article Views (full-text article views including HTML views, PDF and ePub downloads, according to the available data) and Abstracts Views on Vision4Press platform.
Data correspond to usage on the plateform after 2015. The current usage metrics is available 48-96 hours after online publication and is updated daily on week days.
Initial download of the metrics may take a while.