| Issue |
A&A
Volume 584, December 2015
|
|
|---|---|---|
| Article Number | L12 | |
| Number of page(s) | 4 | |
| Section | Letters | |
| DOI | https://doi.org/10.1051/0004-6361/201527360 | |
| Published online | 07 December 2015 | |
A long-period Cepheid variable in the starburst cluster VdBH222⋆
1 Department of Physics and Astronomy, The Open University, Walton Hall, Milton Keynes, MK7 6AA, UK
e-mail: s.clark@open.ac.uk
2 Departamento de Física, Ingeniería de Sistemas y Teoría de la Señal, Universidad de Alicante, Apdo. 99, 03080 Alicante, Spain
3 Institute of Astronomy, University of Cambridge, Madingley Road, Cambridge CB3 0HA, UK
4 Astrophysics Research Institute, Liverpool John Moores University, 146 Brownlow Hill, Liverpool L3 5RF, UK
5 School of Physics & Astronomy, Cardiff University, The Parade, CF24 3AA, Cardiff, UK
Received: 14 September 2015
Accepted: 21 October 2015
Context. Galactic starburst clusters play a twin role in astrophysics, serving as laboratories for the study of stellar physics and also delineating the structure and recent star formation history of the Milky Way.
Aims. In order to exploit these opportunities we have undertaken a spectroscopic survey of the red supergiant dominated young massive clusters thought to be present at both near and far ends of the Galactic Bar.
Methods. Specifically, multi-epoch observations were employed to identify and investigate stellar variability and its potential role in initiating mass loss amongst the cool super-/hypergiant populations of these aggregates.
Results. Significant spectroscopic variability suggestive of radial pulsations was found for the yellow supergiant VdBH 222 #505. Follow-up photometric investigations revealed modulation with a period of ~23.325 d; both timescale and pulsational profile are consistent with a Cepheid classification.
Conclusions. #505 is one of the longest period Galactic cluster Cepheids identified to date and hence of considerable use in constraining the bright end of the period/luminosity relation at solar metallicities. In conjunction with extant photometry we infer a distance of ~6 kpc for VdBH222 and an age of ~20 Myr. This results in a moderate reduction in both the integrated cluster mass (~2×10⁴M⊙) and the initial masses of the evolved cluster members (~10 M⊙). As such VdBH222 becomes an excellent test-bed for studying the properties of some of the lowest mass stars observed to undergo type-II supernovae. Moreover, the distance is in tension with a location of VdBH 222 at the far end of the Galactic Bar. Instead a birthsite in the near 3 kpc arm is suggested; providing compelling evidence of extensive recent star formation in a region of the inner Milky Way which has hitherto been thought to be devoid of such activity.
Key words: stars: variables: Cepheids / Galaxy: structure / open clusters and associations: individual: VdBH222
© ESO, 2015
1. Introduction
Starburst or young massive clusters and the wider cluster complexes or stellar associations within which they are embedded are ubiquitous in external galaxies and appear to be a natural consequence of the physical processes that govern star formation. Historically such entities had been under-represented within our own Galaxy due to heavy extinction within the plane. However the increased prevalence of large-scale (near-)infrared surveys has led to a realisation that it does indeed host a rich population of such stellar aggregates (>104M⊙, <20 Myr; cf. Clark et al. 2013). The implications of such a population is two-fold: they provide a detailed record of recent (high-mass) star formation activity within the Galaxy and delineate its structure, while their constituent co-eval stellar populations make them ideal test-sites for the study of stellar evolution.
Over the past decade it has become clear that within the last ~10−20 Myr a major episode of star formation occurred at the intersection of the base of the Scutum-Crux arm with the near end of the Galactic Bar, resulting in the emergence of at least six young massive clusters embedded within extended halos/associations. These are delineated by their rich red supergiant (RSG) populations and have integrated masses of ≳104M⊙ (RSGC1...6; Figer et al. 2006; Davies et al. 2007; Clark et al. 2009a, González-Fernández & Negueruela 2012, Negueruela et al. 2010, 2011, 2012). An immediate question raised by this finding is whether similar activity is present at the far end of the Galactic Bar. Subsequent (ongoing) observations revealed 4 potential candidates − Mercer 81 (Davies et al. 2012), [DBS2003] 179 (Borissova et al. 2008, 2012), VdBH 222 (Marco et al. 2014; Ma14) and Teutsch 85 (Marco et al., in prep.) − apparently located in this vicinity. Despite comparable masses, both Mercer 81 and [DBS2003] 179 appear significantly younger (~2−5 Myr) than the remaining clusters, with RSGC1...6, VdBH222 and Teutsch 85 all estimated to be ~10−20 Myr old.
The rich cool super-/hypergiant populations of the later clusters permits an investigation of this critical phase of post-main sequence evolution. The extreme mass-loss rates of red supergiants (RSGs) and yellow super-/hypergiants (YS-/HGs) shape the evolutionary pathways and endpoints of massive stars and both types of star have been directly identified as the progenitors of type-II supernovae (e.g. Georgy 2012). In an effort to characterise the variability exhibited by cool super-/hypergiants (e.g. Clark et al. 2010; de Jager 2008; Kiss et al. 2006) − and hence investigate a possible association between this behaviour and (pulsationally driven?) enhanced mass-loss − in 2014 we initiated a multi-epoch spectroscopic survey of members of RSGC2, RSGC3 and VdBH222, including the YSGs VdBH222 #371 and #505 (henceforth #371 and #505).
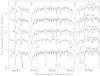 |
Fig. 1 Five epochs of I-band spectroscopy of #505. The dates of individual observations are associated with the relevant spectra. Prominent transitions are indicated; note that Paschen 13, 15 and 16 are located in the blue wings of the Ca ii absorption lines while the blend at 8514 Å is dominated by Fe i. Each spectrum has been wavelength corrected to take into account the mean cluster velocity of VdBH222 of ~–99 km s-1. We highlight the relative weakness of the rich, low-excitation, metallic photospheric lines and greater widths of the Ca ii transitions in the spectrum obtained on August 15 in comparison to the remaining spectra. |
2. Data acquisition, reduction and analysis
2.1. Spectroscopy
During the 44 d interval between 2014 July 12 to August 26 we obtained five epochs of spectroscopy of #505 (Fig. 1). The observations were made using the Fibre Large Array Multi Element Spectrograph (FLAMES; Pasquani et al. 2002), located on VLT UT2 Kueyen at Cerro Paranal. The MEDUSA mode of the GIRAFFE spectrograph was employed and the setup HR21 covering the 8484–9001Å range with R = λ/ Δλ ~ 16 200 was chosen, with individual integrations of 555s. The raw data were reduced with the GIRAFFE pipeline and have been de-biased, flat-fielded and wavelength-calibrated (including a correction to the helio-centric reference system). While discussed in detail in a future publication, we simultaneously observed #371 with the UVES feed of FLAMES. Observations were made from ~6700–10 130Å and a resolving power of ~47 000.
It is apparent that significant variability is present in both the spectral morphology and radial velocity (RV) of #505. This is reminiscent of the behaviour of the cool hypergiant population within Westerlund 1 (e.g. Clark et al. 2010) and hence we interpret this behaviour in terms of radial pulsations. While all five spectra are dominated by photospheric lines from low excitation metallic species, these appear noticeably weaker in the the spectrum from August 15, suggesting an earlier spectral type at this epoch. Classification of stars in this spectroscopic window is described in detail in Negueruela et al. (2011, 2012), Ma14 and references. therein. Specifically, following Carquillat et al. (1997) we employ the Ti i 8683 Å to Fe i 8679 Å line ratio as the primary criterion to infer spectral types for our data. We suggest that #505 varies between ~G2 Ia (~5000 K; August 15 and consistent with the original classification of Ma14) to ~K0 Ia (~4200 K; July 12 and August 26). Note the rapidity of the spectral evolution, with the transition between these extrema occurring over only 10 d. Utilising the strong Fe i lines in the spectrum we determine a maximum ΔRV ~ 40 km s-1 between the same two epochs of observations. The mean of the five measurements −v ~ −95 ± 3 km s-1− is within 1σ of the mean cluster velocity (v ~ −99 ± 4 km s-1; Ma14) strongly supporting membership.
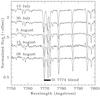 |
Fig. 2 Subsection of the spectra of #371 encompassing the O i 7774 Å blend as well as low excitation metallic photospheric lines, demonstrating a lack of RV variability which appears to exclude identification as a Cepheid. |
Given the correspondence between the temperatures inferred for #505 and the instability strips defined by Tammann et al. (2003) and Bono et al. (2005), a Cepheid classification is immediately suggested, with the magnitude of ΔRV observed consistent with this hypothesis1. Following from the analysis of VdBH22 and constituent stars by Ma14, application of the period/luminosity (P/L) or period/age relations for Cepheids would then suggest a periodicity for #505 in the range ~40−50 d (Bono et al. 2005; Storm et al. 2011).
Conversely, no evidence of pulsations, either in terms of RV variability or changes in spectral morphology, was identified between the five UVES spectra of the second − and more luminous − cluster YSG, #371 (Fig. 2).
2.2. Photometry
Motivated by our spectroscopy, follow-up optical photometry was acquired with the suite of 1-metre instruments that form part of the Las Cumbres Observatory Global Telescope (LCOGT) network; details of both network instrumentation and operations can be found in Brown et al. (2013). Observations were made in a ~110 d interval from 2015 February 3 in V- (58 epochs with 40s exposures), R- (52 epochs with 20s exposures) and SDSS i − (24 epochs with 20s exposures) broadband filters.
Initial bias subtraction and flat-fielding were performed via the automatic pipeline process described by Brown et al. (2013). The images were then realigned and trimmed to a common coordinate system and area and point spread function (PSF)-fitting photometry was carried out using the IRAF package DAOPHOT. Owing to the varying quality of the images (FWHMs ranging from ~2 to ~6 pixels), the fitting was performed individually for each frame, using 3−6 stars located in or near the cluster and of comparable brightness to the targets of interest to construct each PSF. The coordinates of detectable cluster stars were found from a single good image, and then used as the starting points for all other frames, to ensure that the same stars were measured in each case.
Light curves were obtained for both YSGs as well as the nine RSGs and eight blue cluster members identified by Ma14. Unlike #505, #371 and the cluster RSGs exhibited near-identical night-to-night trends indicative of a lack of variability, while the fainter blue stars were more variable and their magnitudes more uncertain. Therefore differential light curves were constructed for #505 using #371 as a comparison star and, independently, an average of the RSGs as a composite check star (Fig. 3); both methods yielding results fully consistent with one another. The resultant lightcurves reveal #505 to be periodically variable. Phase dispersion minimisation was therefore employed to determine a period of ~23.325 ± 0.050 d for the full dataset. The V- and R-band data were then calibrated with extant photometry from Ma14, yielding the final folded light curves presented in Fig. 3. Maxima were obtained on JD 2 457 138.449 (V-band) and 2 457 138.748 (R-band).
The dependence of pulsation profile on period in Cepheids is well known (the Hertzsprung progression; Hertzsprung 1926; Soszyński et al. 2008). Comparison of the pulsational profile of #505 to that of T Mon (period ~27 d; Freedman & Madore 2010) shows an encouraging correspondence; again entirely consistent with a Cepheid classification.
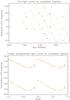 |
Fig. 3 Top panel: differential V-, R- and SDSS i-band lightcurves of VdBH #505 (green, orange and red symbols respectively). Errors associated with the data are smaller than the symbols. Bottom panel: calibrated V- and R-band lightcurves folded on our best-fit ~23.325±0.050 d pulsation period, with phase zero set from the V-band maximum. Symbols and errors as above. |
3. Interpretation and concluding remarks
The location of #505 at the core of VdBH222, as well as its placement on theoretical isochrones that accurately fit the location of the remaining RSG cohort (Ma14), provide a compelling argument for cluster membership. As such the importance of #505 is two-fold. Firstly, it provides a direct measure of the distance to VdBH222. Secondly, if an independent measure of the cluster distance is available − such as a kinematic determination from the mean cluster RV and/or isochrone fitting to the evolved stellar population or the main sequence turn-off − one may invert the argument and utilise the observed properties of #505 to calibrate e.g. the P/L relationship for Cepheids. Consequently, #505 is particularly interesting since its period exceeds that of any of the cluster Cepheids from the recent “optimal” data set compiled by Anderson et al. (2013) and is the second longest of the more recent census of Chen et al. (2015); potentially providing a strong anchor point to the bright end of the P/L relation.
Utilising Eqs. (14) and (19) of Anderson et al. (2013) we first determined ⟨ mV ⟩ = 15.22 ± 0.07 and, from the pulsational period of #505, an absolute V-band magnitude MV = −5.0 ± 0.3 (log( ; bolometric correction from Levesque et al. 2006). The colour excess can be calculated from our data and the J-band magnitude from Ma14 via Eqs. (15) and (16) of Anderson et al. (2013); we found E(B−V) = 2.07 ± 0.07. Adopting RV ~ 2.9 (Ma14) and the colours of a late G supergiant (Fernie 1963) yielded Av ~ 6.5 and hence a distance to #505 of
  kpc, noting that the formal errors quoted do not take into account uncertainty in the determination of RV for the cluster (cf. Ma14). Finally, employing the period-age relationship of Bono et al. (2005) we arrived at an age of ~
 Myr for the star.
Motivated by our current understanding of Galactic structure and star formation activity, Ma14 favoured an age of ~12 Myr and distance of ~10 kpc for VdBH222, placing it at the far end of the Galactic Bar. Such a location is also compatible with the far kinematic distance inferred from the mean cluster RV. Nevertheless, such a solution is clearly in tension with the properties inferred from #505; for example at such an age one would expect a pulsational period of ~69 d (Bono et al. 2005). However the near kinematic distance of ~6 kpc (Ma14) is entirely consistent with that determined independently for VdBH222 from #505, with such a distance also consonant with extant photometry, assuming an age of ~20 Myr (Ma14).
Although not a Cepheid, the spectrum of #371 provides one further argument for the nearside distance to VdBH222. Our new spectroscopy encompasses the O i 7774 Å blend (Fig. 2), from the strength of which (Equivalent Width = −1.26 ± 0.05 Å) we may infer MV ~ −6.1 ± 0.9 following the calibration of Arellano Ferro et al. (2003). Assuming cluster membership this, too, is consistent with a distance of ~6 kpc.
Before accepting this distance we recognise two potential caveats. Firstly, Ma14 identify a population of blue cluster members of apparent B-spectral type, which they tentatively conclude to be luminosity class Ib-II. If VdBH222 is located at a distance of ~6 kpc these would instead be either main sequence or giant stars; hence their properties provide an independent observational test of this revision. Secondly one might ask why the second cluster YSG, #371, shows no spectroscopic or photometric evidence for pulsations − given that our new data are consistent with with the G0 Ia+ classification of Ma14, implying log Teff ~ 3.72 and hence potentially locating it within the Cepheid instability strip (cf. Fig. 1 of Anderson et al. 2014)? A possible explanation may be found in the proposed upper bound for the instability strip (log (L/Lbol) ~ 4.3; Anderson et al. 2014); even allowing for the nearside distance, the photometrically-determined luminosity of #371 (Ma14) exceeds this value, while our spectroscopic estimate from the calibration of the O i 7774 Å blend coincides with this limit (log( ; consistent with the photometrically-determined value within the error estimates). In contrast, for a distance of ~6 kpc, the luminosity of #505 is below this threshold and hence one would expect it to show Cepheid behaviour. Conversely, at a distance of ~10 kpc both stars would exceed the upper luminosity limit of the Cepheid instability strip and hence neither should exhibit pulsations (cf. footnote 1).
In such a scenario the discrepancy in luminosities between #371 and #505 could result from the former being more massive and/or more rapidly rotating than the latter. Rapid rotation leads to a more luminous post main sequence evolutionary path for a given initial mass and also a longer lifetime on the main sequence (Anderson et al. 2014). The latter implies that under the assumption of co-evality for VdBH22, the progenitor of #371 would have had to be more massive than #505 for both stars to currently be observed in the same evolutionary phase, also implying a greater luminosity for the former.
3.1. Implications of a reduced distance to VdBH222
What, then, are the physical implications if VdBH222 is located at the nearside kinematic distance of ~6 kpc? In conjunction with extant photometry and the distribution of spectral types of known cluster members (Ma14) and given the relatively large uncertainties associated with inferring an age from the pulsational period of #505, we favour a cluster age of ~20 Myr. If confirmed via future observations of e.g. the main sequence turn-off, VdBH222 would be the oldest of the RSG dominated clusters (cf. Sect. 1) and its integrated mass would undergo a moderate downwards revision to ~2 × 10⁴M⊙ (Ma14, Clark et al. 2009b). Likewise the initial mass of the cluster members would be lower. Anderson et al. (2014) quote a rotationally-dependent maximum mass of ~10.5−11.5 M⊙ for Cepheids, which serves as a lower limit to the mass of #371. Adopting the mass/luminosity relations of these authors suggests a slightly lower mass for #505 of ~ , subject to uncertainties in distance, bolometric correction, reddening law and initial rotational rate. Estimates for both stars are therefore broadly consistent with that derived for the evolved stellar cohort from the age of VdBH222.
This is of considerable interest since the evolutionary endpoint of ~7−10 M⊙ stars − e.g white dwarf, electron-capture or core-collapse supernova − is uncertain (Poelarends et al. 2008; Jones et al. 2013; Doherty et al. 2015). Observationally, searches for the pre-explosion counterparts of type-II supernovae return a progenitor mass-range of ~7−16 M⊙ (Smartt et al. 2015), suggesting that at least some such stars do explode. Unfortunately, to date few examples of low mass (≲10 M⊙) RSGs within Galactic clusters have been identified; VdBH222 therefore provides an excellent laboratory for studying the properties of such objects. Likewise, #505 and #371 serve as ideal test-subjects to validate theoretical predictions of Cepheid behaviour for the type of high-luminosity star that is critical to extragalactic distance determinations (Anderson et al. 2014) and, ultimately, determination of the Hubble constant.
Finally, a distance of ~6 kpc is unexpected given our current understanding of Galactic structure and recent star formation history. Such a distance places VdBH222 in, or in the vicinity of, the inner 3 kpc Galactic arm (van Woerden et al. 1957). This is very poorly traced in molecular gas and historically has not been thought to host active star formation (e.g. Lockman 1980). However methanol maser emission − considered to be uniquely associated with massive star formation − has recently been detected within it (Green et al. 2009), as have both H ii regions (Caswell & Haynes 1987) and IR-colour selected candidate massive young stellar objects (Busfield et al. 2006), potentially challenging this orthodoxy.
Sanna et al. (2014) placed the massive star-forming region W31 in the 3 kpc arm, although the findings of Furness et al. (2010) dispute this assertion, favouring a much smaller distance. Given this uncertainty, VdBH 222 provides the first compelling observational proof of significant recent star-formation activity
within this region. Indeed, by analogy to the RSG dominated clusters at the near-end of the Galactic Bar we might expect VdBH222 to be associated with an equally massive, diffuse association/halo, suggesting several ~104M⊙ of stars to have formed within the last ~20 Myr (a scenario we investigate in a future work). Nevertheless, and irrespective of this hypothesis, VdBH222 appears to represent the end-point of vigorous, recent star formation in the 3 kpc arm; an entirely unexpected result given the apparent lack of sufficient raw material to fuel such activity and the dynamical effects of the Galactic Bar sweeping through the region.
Notwithstanding that the bolometric luminosity estimated by Ma14 ((Lbol/L⊙) ~ 4.6 for a kinematic distance of ~10 kpc) exceeds the upper limit of the Cepheid instability strip reported by Anderson et al. (2014).
Acknowledgments
We thank Hugo M. Tabernero for additional data reduction. This research is partially supported by the Spanish Ministerio de Economía y Competitividad under grant AYA2012-39364-C02-02, and the European Union. The Faulkes Telescopes are maintained and operated by Las Cumbres Observatory Global Telescope Network.
References
- Anderson, R. I., Eyer, L., Mowlavi, N. 2013, MNRAS, 434. 2238 [Google Scholar]
- Anderson, R. I., Ekström, S., Georgy, C., et al. 2014, A&A, 564, A100 [NASA ADS] [CrossRef] [EDP Sciences] [Google Scholar]
- Arellano Ferro, A., Giridhar, S., & Rojo Arellano, E. 2003, Rev. Mex. Astron. Astrofis., 39, 3 [Google Scholar]
- Bono, G., Marconi, M., Cassis, S., et al. 2005, ApJ, 621, 966 [NASA ADS] [CrossRef] [Google Scholar]
- Borrisova, J., Ivanov, V. D., Hanson, M. M., et al. 2008, A&A, 488, 151 [NASA ADS] [CrossRef] [EDP Sciences] [Google Scholar]
- Borissova, J., Georgiev, L., Hanson, M. M., et al. 2012, A&A, 546, A110 [NASA ADS] [CrossRef] [EDP Sciences] [Google Scholar]
- Brown, T. M., Baliber, N., Bianco, F. B., 2013, PASP, 125, 1031 [NASA ADS] [CrossRef] [Google Scholar]
- Busfield, A. L., Purcell, C. R., Hoare, M. R., et al. 2006, MNRAS, 366, 1096 [NASA ADS] [CrossRef] [Google Scholar]
- Carquillat, J. M., Jaschek, C., Jaschek, M., & Ginestet, N. 1997, A&AS, 123, 5 [NASA ADS] [CrossRef] [EDP Sciences] [Google Scholar]
- Caswell, J. L., & Haynes, R. F. 1987, A&A, 171, 261 [NASA ADS] [Google Scholar]
- Chen, X., de Grijs, R., & Deng, L. 2015, MNRAS, 446, 1268 [NASA ADS] [CrossRef] [Google Scholar]
- Clark, J. S., Negueruela, I., Davies, B., et al. 2009a, A&A, 498, 109 [NASA ADS] [CrossRef] [EDP Sciences] [Google Scholar]
- Clark, J. S., Davies, B., Najarro, F., et al. 2009b, A&A, 504, 429 [NASA ADS] [CrossRef] [EDP Sciences] [Google Scholar]
- Clark, J. S., Ritchie, B. W., Negueruela, I. 2010, A&A, 514, A87 [NASA ADS] [CrossRef] [EDP Sciences] [Google Scholar]
- Clark, J. S., Ritchie, B. W., & Negueruela, I. 2013, A&A, 560, A11 [NASA ADS] [CrossRef] [EDP Sciences] [Google Scholar]
- Davies, B., Figer, D. F., Kudritzki, R.-P., et al. 2007, ApJ, 671, 781 [NASA ADS] [CrossRef] [Google Scholar]
- Davies, B., de La Fuente, D., Najarro, F., et al. 2012, MNRAS, 419, 1860 [NASA ADS] [CrossRef] [Google Scholar]
- de Jager, C. 1998, A&ARv, 8, 145 [NASA ADS] [CrossRef] [Google Scholar]
- Doherty, C. L., Gil-Pons, P., Siess, L., Lattanzio, J. C., & Lau, H. H. B. 2015, MNRAS, 446, 2599 [Google Scholar]
- Fernie, J. D. 1963, AJ, 68, 780 [NASA ADS] [CrossRef] [Google Scholar]
- Figer, D. F., MacKenty, J. W., Robberto, M., et al. 2006, ApJ, 643, 1166 [NASA ADS] [CrossRef] [Google Scholar]
- Freedman, W. L., & Madore, B. F. 2010, ApJ, 719, 335 [NASA ADS] [CrossRef] [Google Scholar]
- Furness, J. P., Crowther, P. A., Morris, P. W., et al. 2010, MNRAS, 403, 1433 [NASA ADS] [CrossRef] [Google Scholar]
- Georgy, C. 2012, A&A, 538, L8 [NASA ADS] [CrossRef] [EDP Sciences] [Google Scholar]
- González-Fernández, C., & Negueruela, I. 2012, A&A, 539, A100 [NASA ADS] [CrossRef] [EDP Sciences] [Google Scholar]
- Green, J. A., McClure-Griffiths, N. M., Caswell, J. L., et al. 2009, ApJ, 696, L156 [NASA ADS] [CrossRef] [Google Scholar]
- Hertzsprung, E. 1926, BAN, 3, 115 [NASA ADS] [Google Scholar]
- Jones, S., Hirschi, R., Nomoto, K., et al. 2013, ApJ, 772, 150 [NASA ADS] [CrossRef] [Google Scholar]
- Kiss, L. L., Szabó, Gy. M., & Bedding, T. R. 2006, MNRAS, 372, 1721 [Google Scholar]
- Levesque, E. M., Massey, P., Olsen, K., et al. 2006, ApJ, 645, 1102 [NASA ADS] [CrossRef] [Google Scholar]
- Lockman, F. J. 1980, ApJ, 241, 200 [NASA ADS] [CrossRef] [Google Scholar]
- Marco, A., Negueruela, I., González-Fernández, C., et al. 2014, A&A, 567, A73 [NASA ADS] [CrossRef] [EDP Sciences] [Google Scholar]
- Negueruela, I., González-Fernández, C., Marco, A., Clark, J. S., & Martínez-Núñez, S. 2010, A&A, 53, A74 [NASA ADS] [CrossRef] [EDP Sciences] [Google Scholar]
- Negueruela, I., González-Fernández, C., Marco, A., & Clark, J. S. 2011, A&A, 528, A59 [Google Scholar]
- Negueruela, I., Marco, A., González-Fernández, C., et al. 2012, A&A, 547, A15 [NASA ADS] [CrossRef] [EDP Sciences] [Google Scholar]
- Pasquani, L., Avila, G., Blecha, A., et al. 2002, The Messenger, 110, 1 [NASA ADS] [Google Scholar]
- Poelarends, A. J. T., Herwig, F., Langer, N., & Heger, A. 2008, ApJ, 675, 614 [NASA ADS] [CrossRef] [Google Scholar]
- Sanna, A., Reid, M. J., Menten, K. M., et al. 2014, ApJ, 781, 108 [NASA ADS] [CrossRef] [Google Scholar]
- Smartt, S. 2015, PASA, 32, 16 [Google Scholar]
- Soszyński, I., Poleski, R., Udalski, A., et al. 2008, Acta Astron., 58, 163 [NASA ADS] [Google Scholar]
- Storm, J., Gieren, W., Fouqué, P., et al. 2011, A&A, 534, A94 [NASA ADS] [CrossRef] [EDP Sciences] [Google Scholar]
- Tammann, G. A., Sandage, A., & Reindl, B. 2003, A&A, 404, 423 [NASA ADS] [CrossRef] [EDP Sciences] [Google Scholar]
- van Woerden, H., Rougoor, G. W., & Oort, J. H. 1957, C. R. Acad. Sc. Paris, 244, 1691 [Google Scholar]
All Figures
|
Fig. 1 Five epochs of I-band spectroscopy of #505. The dates of individual observations are associated with the relevant spectra. Prominent transitions are indicated; note that Paschen 13, 15 and 16 are located in the blue wings of the Ca ii absorption lines while the blend at 8514 Å is dominated by Fe i. Each spectrum has been wavelength corrected to take into account the mean cluster velocity of VdBH222 of ~–99 km s-1. We highlight the relative weakness of the rich, low-excitation, metallic photospheric lines and greater widths of the Ca ii transitions in the spectrum obtained on August 15 in comparison to the remaining spectra. |
| In the text | |
|
Fig. 2 Subsection of the spectra of #371 encompassing the O i 7774 Å blend as well as low excitation metallic photospheric lines, demonstrating a lack of RV variability which appears to exclude identification as a Cepheid. |
| In the text | |
|
Fig. 3 Top panel: differential V-, R- and SDSS i-band lightcurves of VdBH #505 (green, orange and red symbols respectively). Errors associated with the data are smaller than the symbols. Bottom panel: calibrated V- and R-band lightcurves folded on our best-fit ~23.325±0.050 d pulsation period, with phase zero set from the V-band maximum. Symbols and errors as above. |
| In the text | |
Current usage metrics show cumulative count of Article Views (full-text article views including HTML views, PDF and ePub downloads, according to the available data) and Abstracts Views on Vision4Press platform.
Data correspond to usage on the plateform after 2015. The current usage metrics is available 48-96 hours after online publication and is updated daily on week days.
Initial download of the metrics may take a while.