Fig. 2
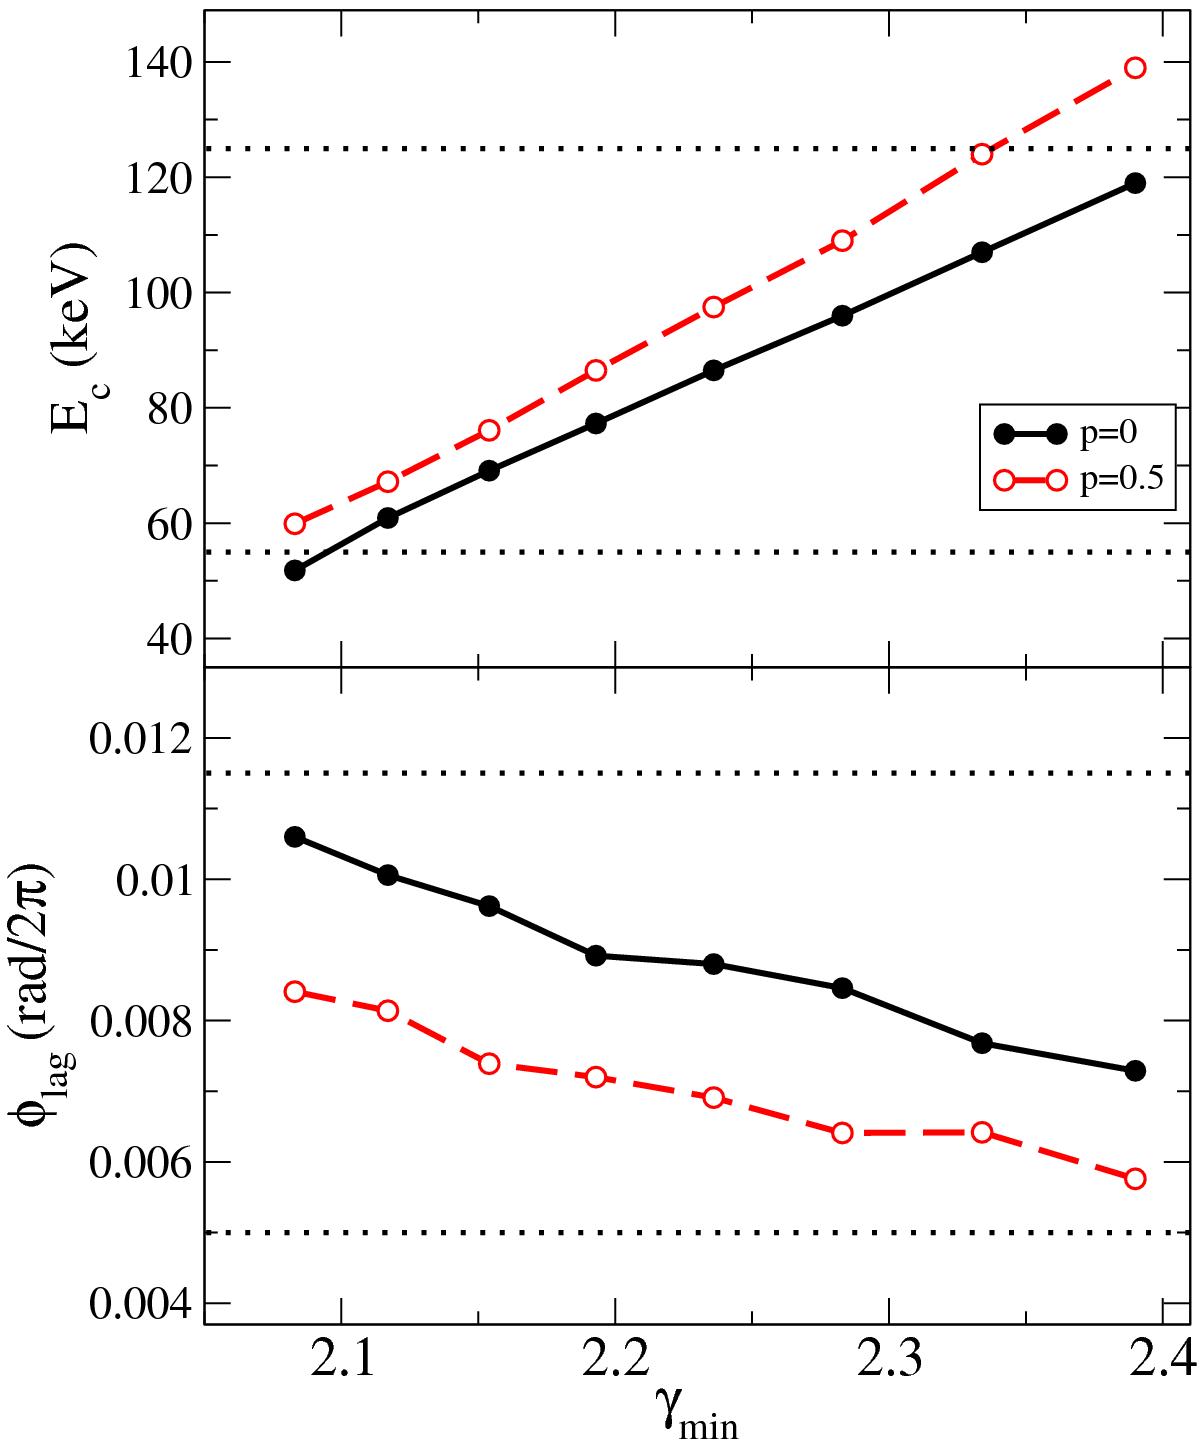
Cutoff energy and phase lag as functions of γmin without (filled circles) and with an acceleration zone (empty circles). Each point represents a calculation with the same τ∥ = 5 and different γmin (v⊥). The horizontal dotted lines bracket the ranges of observed values as in Motta et al. (2009) for Ec and Altamirano & Méndez (2015) for φlag.
Current usage metrics show cumulative count of Article Views (full-text article views including HTML views, PDF and ePub downloads, according to the available data) and Abstracts Views on Vision4Press platform.
Data correspond to usage on the plateform after 2015. The current usage metrics is available 48-96 hours after online publication and is updated daily on week days.
Initial download of the metrics may take a while.