Fig. 4
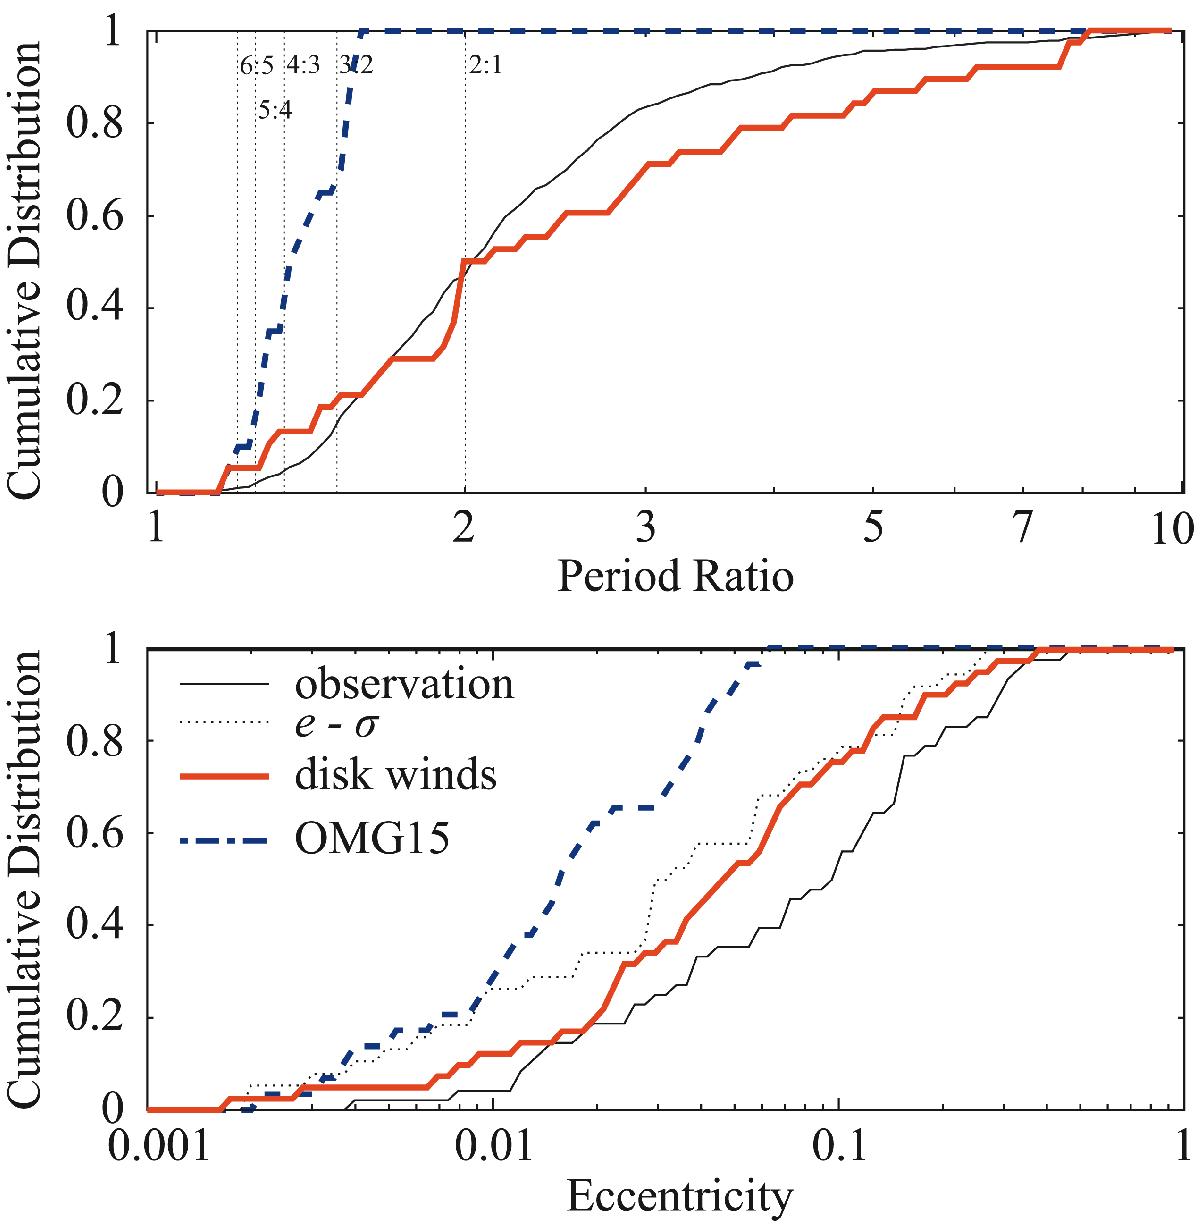
Comparison of cumulative period ratio distributions and eccentricity distributions. Thin solid lines show observed distributions of confirmed close-in super-Earths as of June 2015 (341 systems with 854 planets). Thick solid lines indicate results of simulations including the effects of disk winds, while thick dashed lines show the previous results for model 1 in OMG15. As discussed in OMG15, observed eccentricities can be overestimated (e.g., Shen & Turner 2008; Zakamska et al. 2011). The thin dotted line shows the eccentricity distribution, in which each eccentricity is assumed to be e−σ. Here, σ is the estimated error.
Current usage metrics show cumulative count of Article Views (full-text article views including HTML views, PDF and ePub downloads, according to the available data) and Abstracts Views on Vision4Press platform.
Data correspond to usage on the plateform after 2015. The current usage metrics is available 48-96 hours after online publication and is updated daily on week days.
Initial download of the metrics may take a while.