Fig. 2
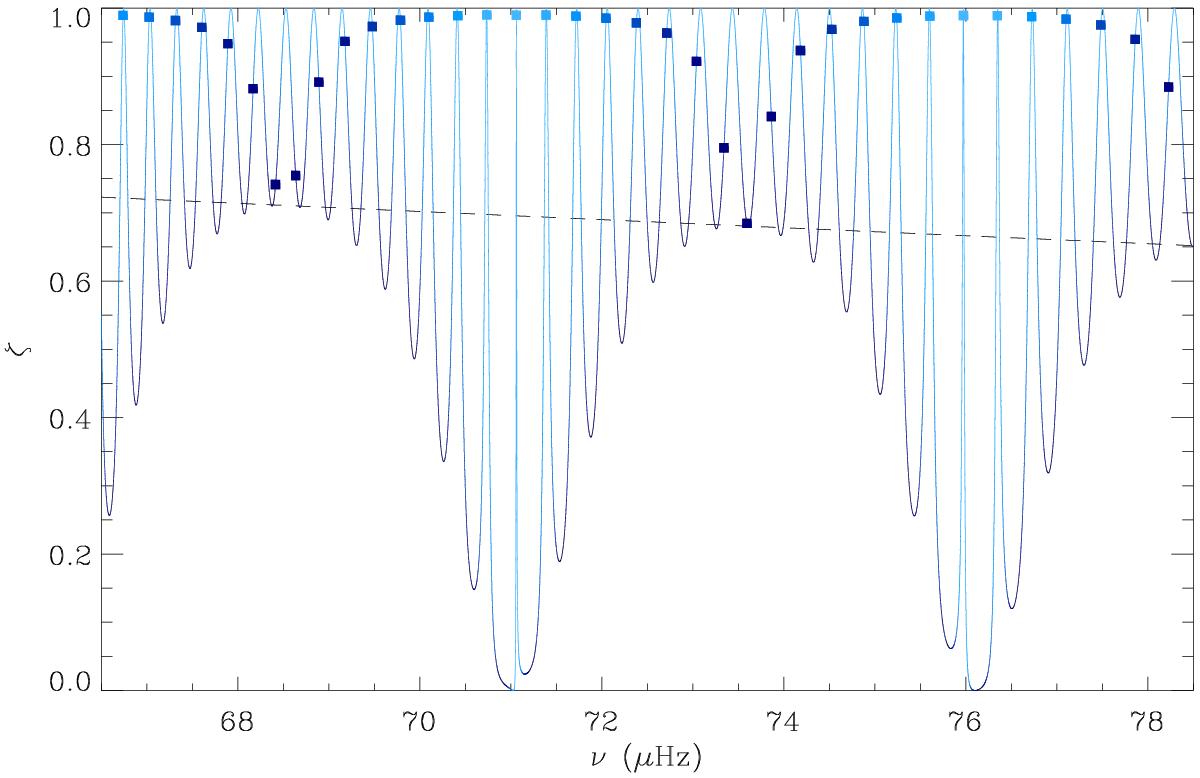
Comparison of the function ζ considered as a continuous function of frequency (continuous line with color modulated by the value of cos2θg) with the values derived for the mixed-mode frequencies (full squares with color modulated by the value of cos2θp). Values of cos2 close to 0 and 1 appear in light blue and dark blue, respectively. For gravity-dominated mixed modes, the phase term θp acts for ζ values close to the local maxima; for pressure-dominated mixed modes, the ζ values are close to the local minima ζmin (dashed line). The simulation is based on the second-order asymptotic pressure-mode pattern proposed for red giants by Mosser et al. (2013), with Δν = 5 μHz, and on the first-order asymptotic expansion of gravity modes, with ΔΠ1 = 65 s and εg = 0.
Current usage metrics show cumulative count of Article Views (full-text article views including HTML views, PDF and ePub downloads, according to the available data) and Abstracts Views on Vision4Press platform.
Data correspond to usage on the plateform after 2015. The current usage metrics is available 48-96 hours after online publication and is updated daily on week days.
Initial download of the metrics may take a while.