Fig. 1
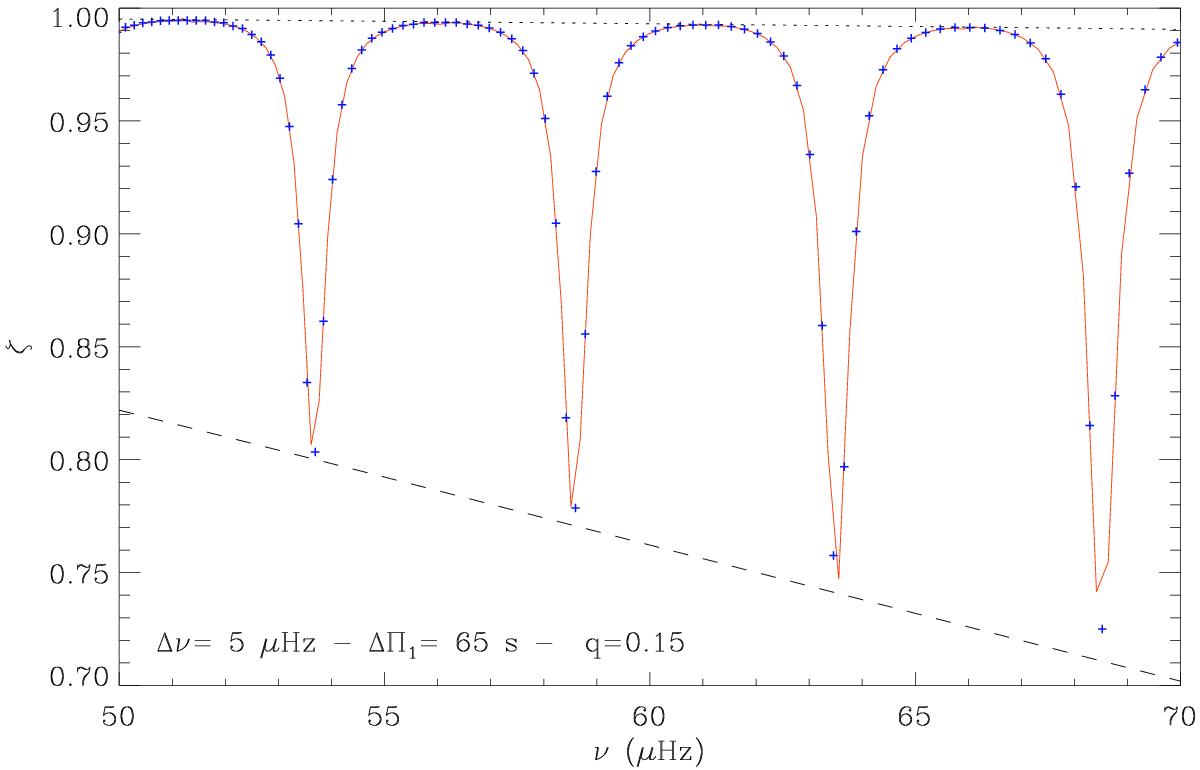
Relative period spacings ΔP/ ΔΠ1 and relative rotational splittings ζ for a synthetic RGB mixed-mode spectrum. The red line shows the asymptotic ζ function; the blue crosses represent the period spacings derived from the asymptotic expansion of mixed modes and scaled to ΔΠ1. The dashed line shows the minimum values ζmin reached by pressure-dominated mixed modes; the dotted line shows the maximum values ζmax reached by gravity-dominated mixed modes.
Current usage metrics show cumulative count of Article Views (full-text article views including HTML views, PDF and ePub downloads, according to the available data) and Abstracts Views on Vision4Press platform.
Data correspond to usage on the plateform after 2015. The current usage metrics is available 48-96 hours after online publication and is updated daily on week days.
Initial download of the metrics may take a while.