Fig. 6
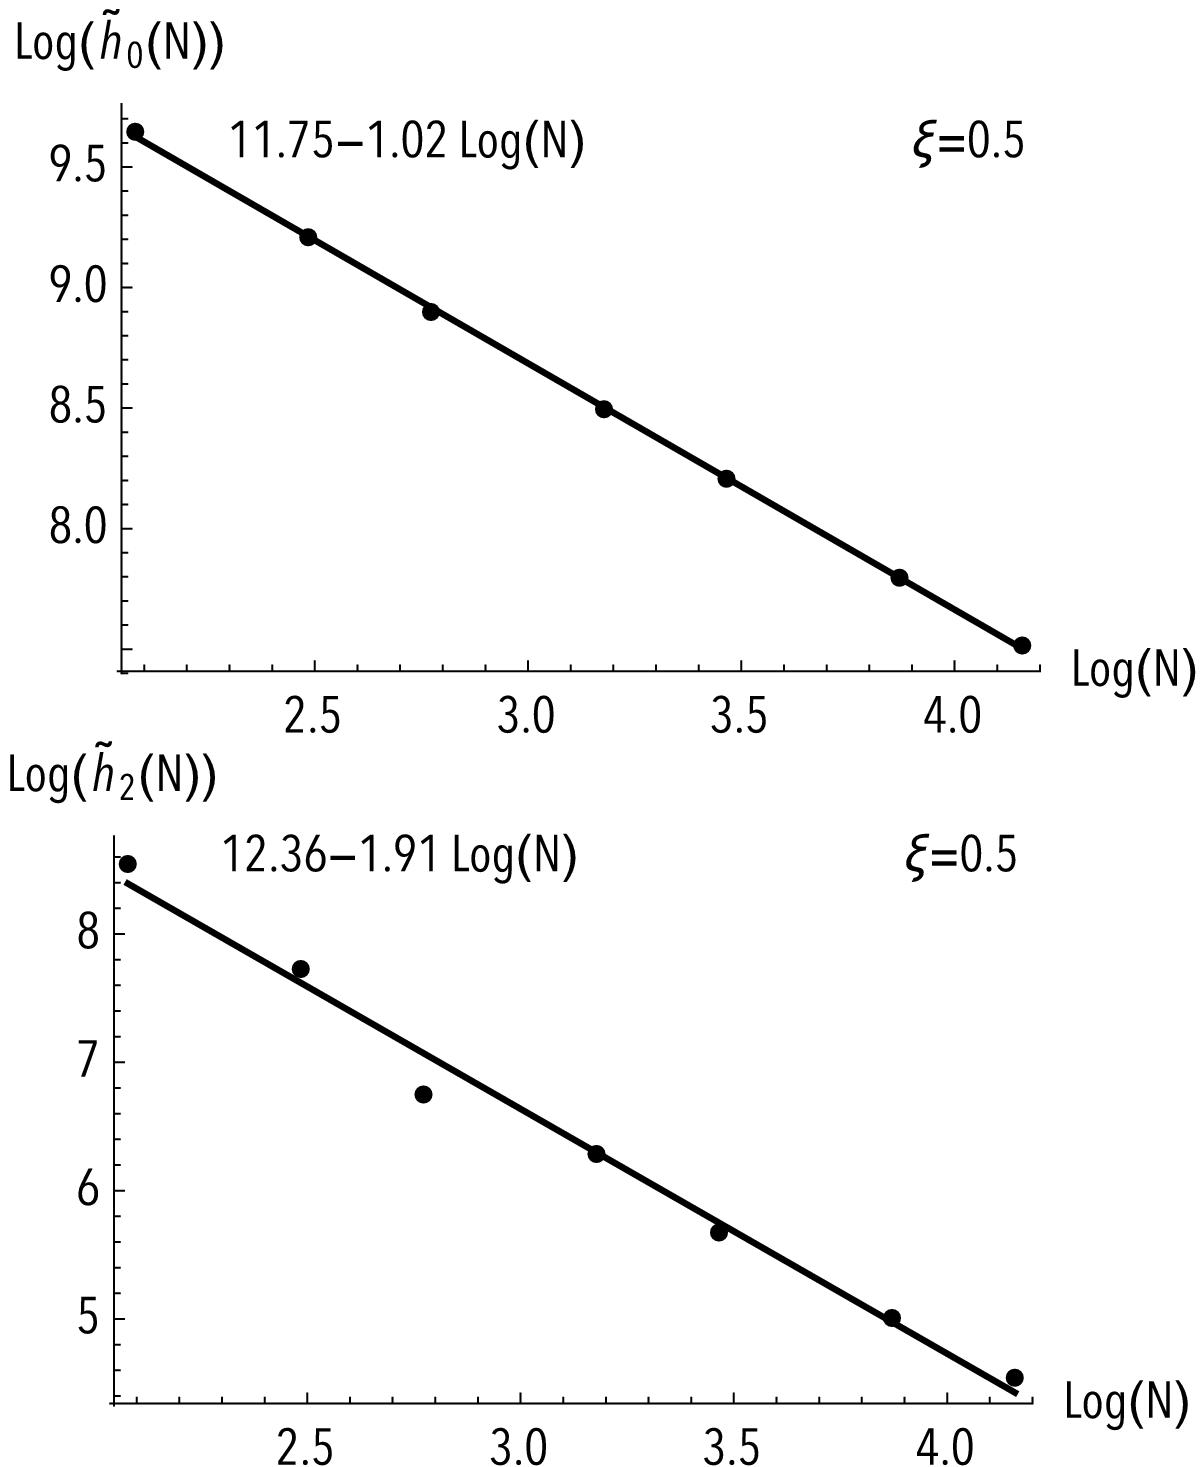
Top panel: illustration of the behaviour of the function ![]() , where N has been rescaled by a factor 10-5 so as to simplify the representation. The dots correspond to computed values thanks to Fig. 5, while the line corresponds to a linear fit, which takes the form
, where N has been rescaled by a factor 10-5 so as to simplify the representation. The dots correspond to computed values thanks to Fig. 5, while the line corresponds to a linear fit, which takes the form ![]() . The coefficients
. The coefficients ![]() have been uniformly renormalised so as to clarify this representation. Bottom panel: similar representation for the behaviour of the function
have been uniformly renormalised so as to clarify this representation. Bottom panel: similar representation for the behaviour of the function ![]() , whose linear fit takes the form
, whose linear fit takes the form ![]() . Similarly, the coefficients
. Similarly, the coefficients ![]() have been uniformly renormalised so as to clarify this representation.
have been uniformly renormalised so as to clarify this representation.
Current usage metrics show cumulative count of Article Views (full-text article views including HTML views, PDF and ePub downloads, according to the available data) and Abstracts Views on Vision4Press platform.
Data correspond to usage on the plateform after 2015. The current usage metrics is available 48-96 hours after online publication and is updated daily on week days.
Initial download of the metrics may take a while.