Fig. D.3
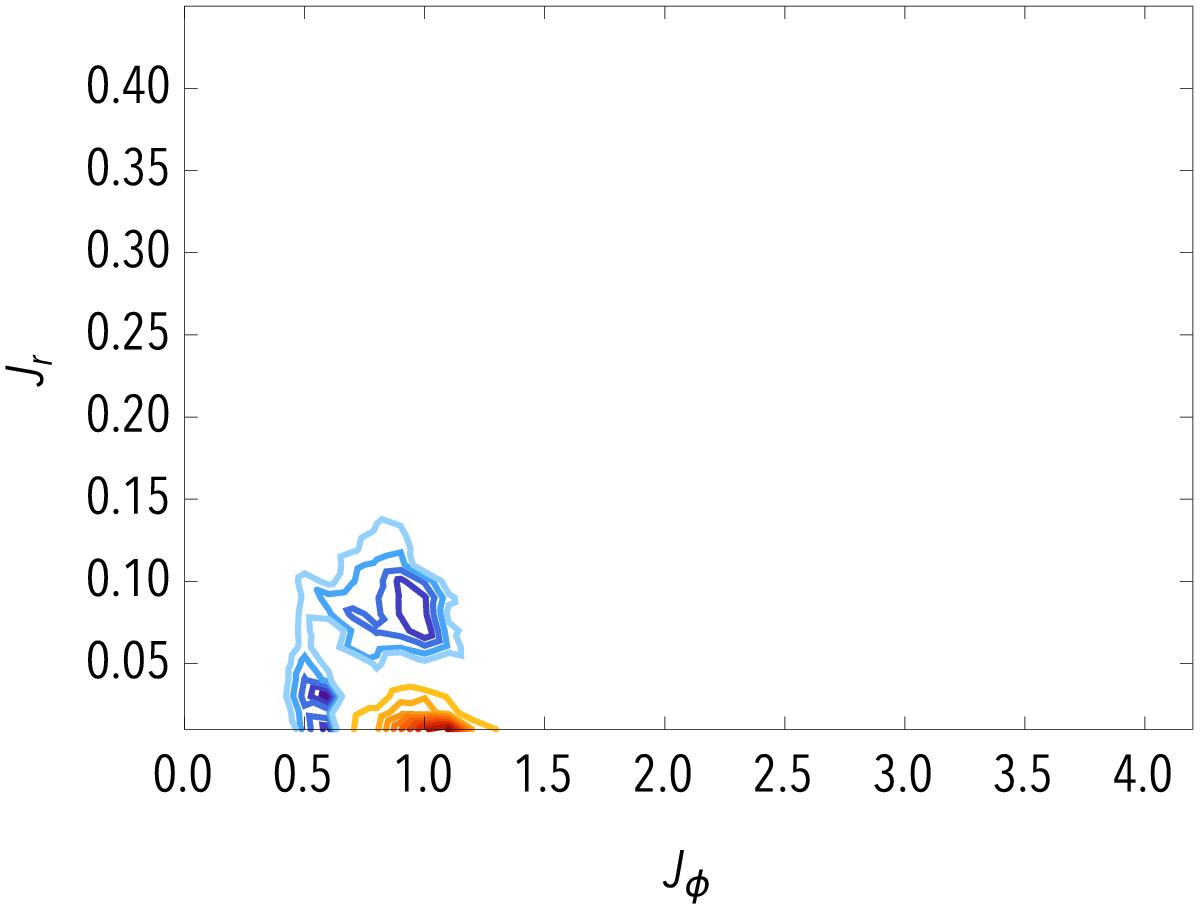
Map of ![]() , corresponding to the dressed secular diffusion flux, using the same conventions as in Fig. 4. In order to limit ourselves only to tightly wound contributions, the basis elements associated with the radial basis index n ∈ {0,1 } have not been taken into account. The contours are spaced linearly between the minimum and the maximum of
, corresponding to the dressed secular diffusion flux, using the same conventions as in Fig. 4. In order to limit ourselves only to tightly wound contributions, the basis elements associated with the radial basis index n ∈ {0,1 } have not been taken into account. The contours are spaced linearly between the minimum and the maximum of ![]() . The maximum value for the positive blue contours corresponds to
. The maximum value for the positive blue contours corresponds to ![]() , while the minimum for the negative red contours is associated with
, while the minimum for the negative red contours is associated with ![]() . This figure is to be compared to Fig. 9 of Paper I.
. This figure is to be compared to Fig. 9 of Paper I.
Current usage metrics show cumulative count of Article Views (full-text article views including HTML views, PDF and ePub downloads, according to the available data) and Abstracts Views on Vision4Press platform.
Data correspond to usage on the plateform after 2015. The current usage metrics is available 48-96 hours after online publication and is updated daily on week days.
Initial download of the metrics may take a while.