Fig. 8
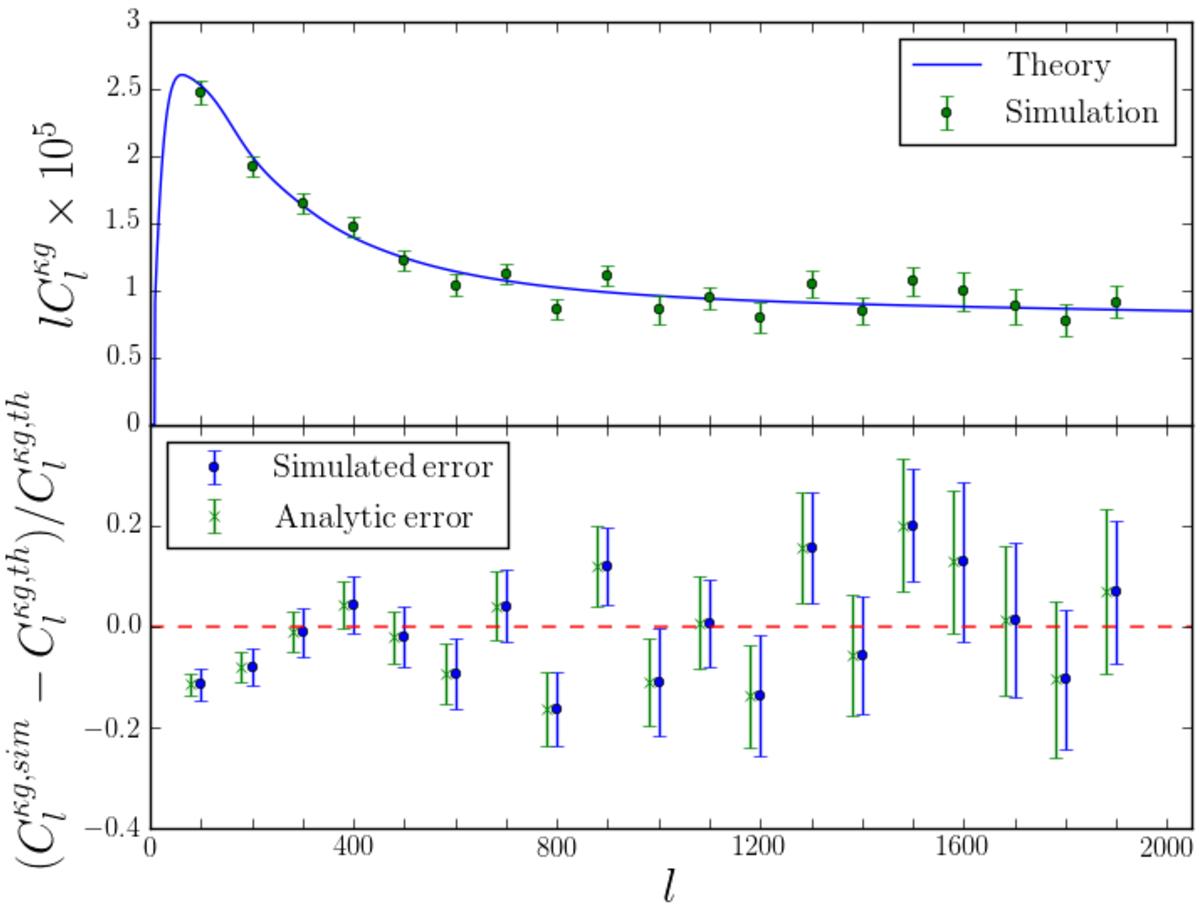
Upper panel: cross-correlation of the simulated galaxy and lensing maps using b = 1. The solid line represents the input cross-correlation, and the points represent the reconstructed cross-correlation averaged over Nsim = 100 simulations, together with the simulated error bars. Lower panel: fractional difference between the input and the recovered cross-correlations. The blue error bars are recovered from the simulations using Eq. (54) for the covariance matrix, and the red ones are analytic using Eq. (24) for the covariance, keeping only the Gaussian term.
Current usage metrics show cumulative count of Article Views (full-text article views including HTML views, PDF and ePub downloads, according to the available data) and Abstracts Views on Vision4Press platform.
Data correspond to usage on the plateform after 2015. The current usage metrics is available 48-96 hours after online publication and is updated daily on week days.
Initial download of the metrics may take a while.