Fig. 11
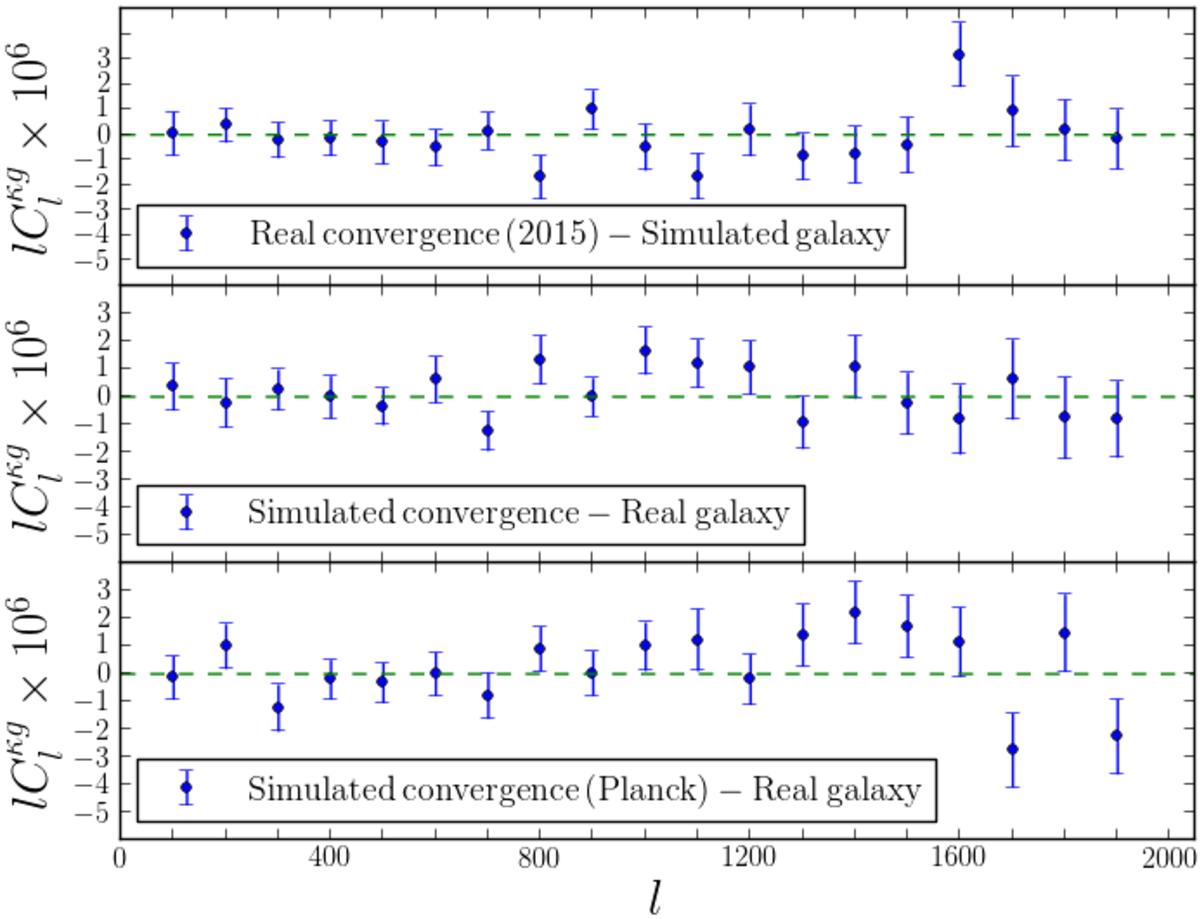
Upper panel: mean correlation between the true lensing map of 2015 and 100 simulated galaxy maps using all patches. Middle panel: mean correlation between the true galaxy map using all patches and 100 gaussian simulated lensing maps. Lower panel: mean correlation between the true galaxy map using all patches and 100 Planck simulated lensing maps. In all cases the signal is consistent with no correlation.
Current usage metrics show cumulative count of Article Views (full-text article views including HTML views, PDF and ePub downloads, according to the available data) and Abstracts Views on Vision4Press platform.
Data correspond to usage on the plateform after 2015. The current usage metrics is available 48-96 hours after online publication and is updated daily on week days.
Initial download of the metrics may take a while.