Free Access
Fig. C.2
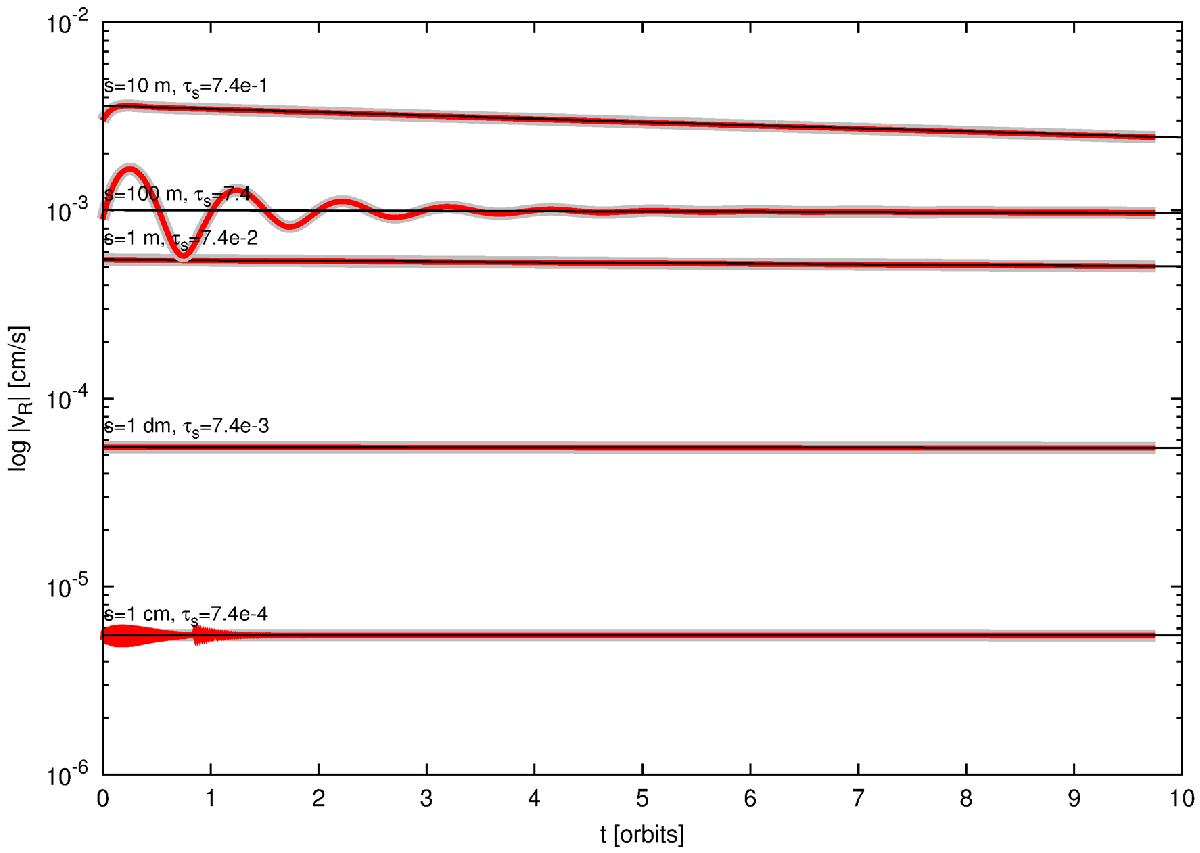
Evolution of the particle drift speed in the first ten orbits for particles with different stopping times. The analytic solution obtained from Eq. (C.1) is plotted with a black line, while the drift speed obtained from the semi-implicit and fully implicit integrators are displayed with red and grey lines, respectively.
Current usage metrics show cumulative count of Article Views (full-text article views including HTML views, PDF and ePub downloads, according to the available data) and Abstracts Views on Vision4Press platform.
Data correspond to usage on the plateform after 2015. The current usage metrics is available 48-96 hours after online publication and is updated daily on week days.
Initial download of the metrics may take a while.