Free Access
Fig. 20
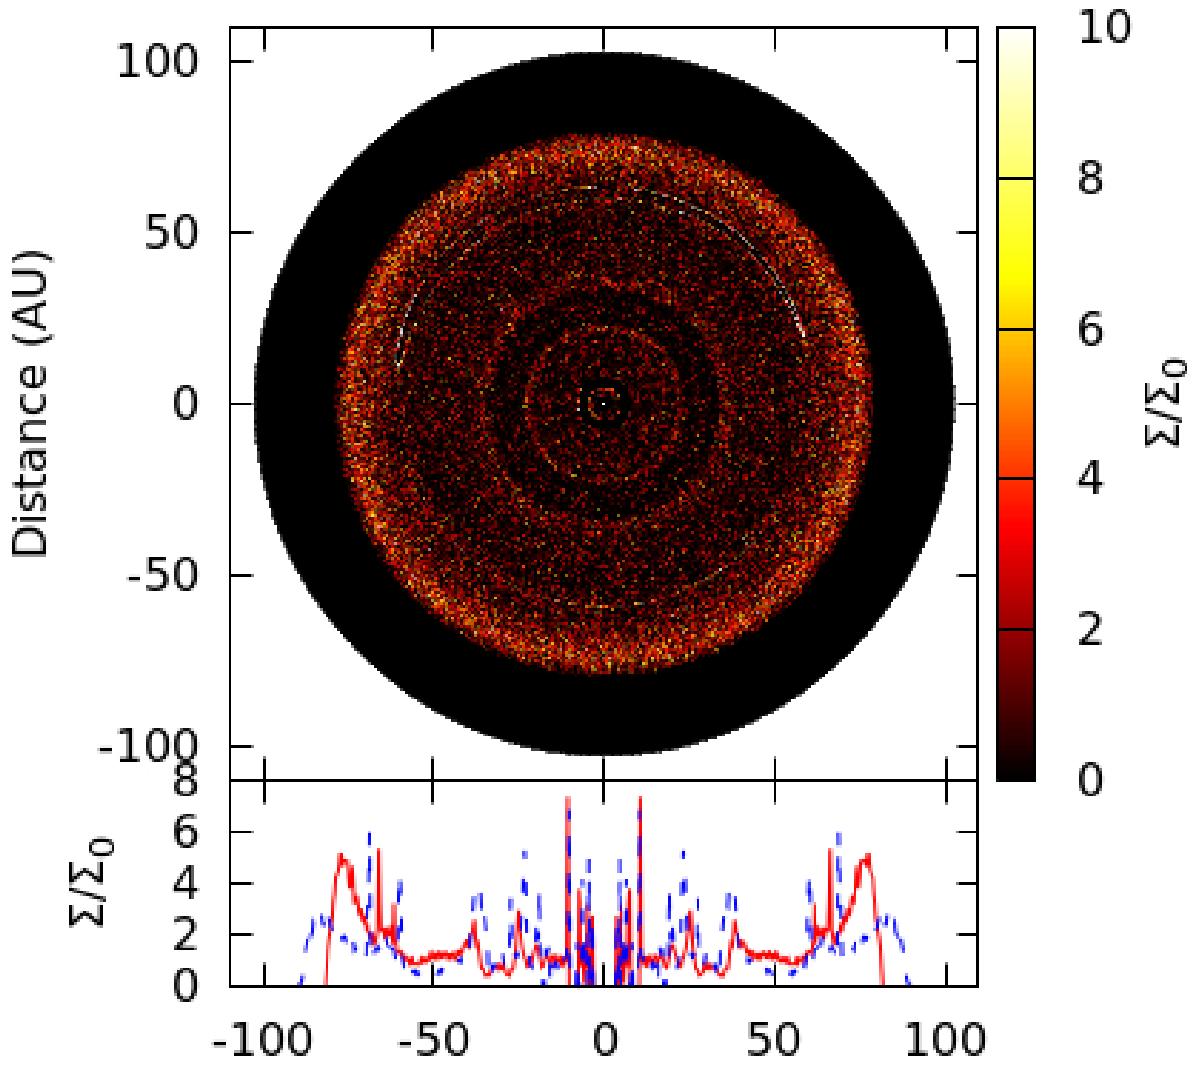
Top panel: dust distribution for the mm-sized particles disk and two planetary cores of ~10 and ~20 M⊕ after 250 orbits of the inner planet. Bottom panel: relative surface density distribution (red solid curve) where the distribution of the higher disk mass case (from Fig. 19 has been overplotted (blue dashed curve).
Current usage metrics show cumulative count of Article Views (full-text article views including HTML views, PDF and ePub downloads, according to the available data) and Abstracts Views on Vision4Press platform.
Data correspond to usage on the plateform after 2015. The current usage metrics is available 48-96 hours after online publication and is updated daily on week days.
Initial download of the metrics may take a while.