Fig. 12
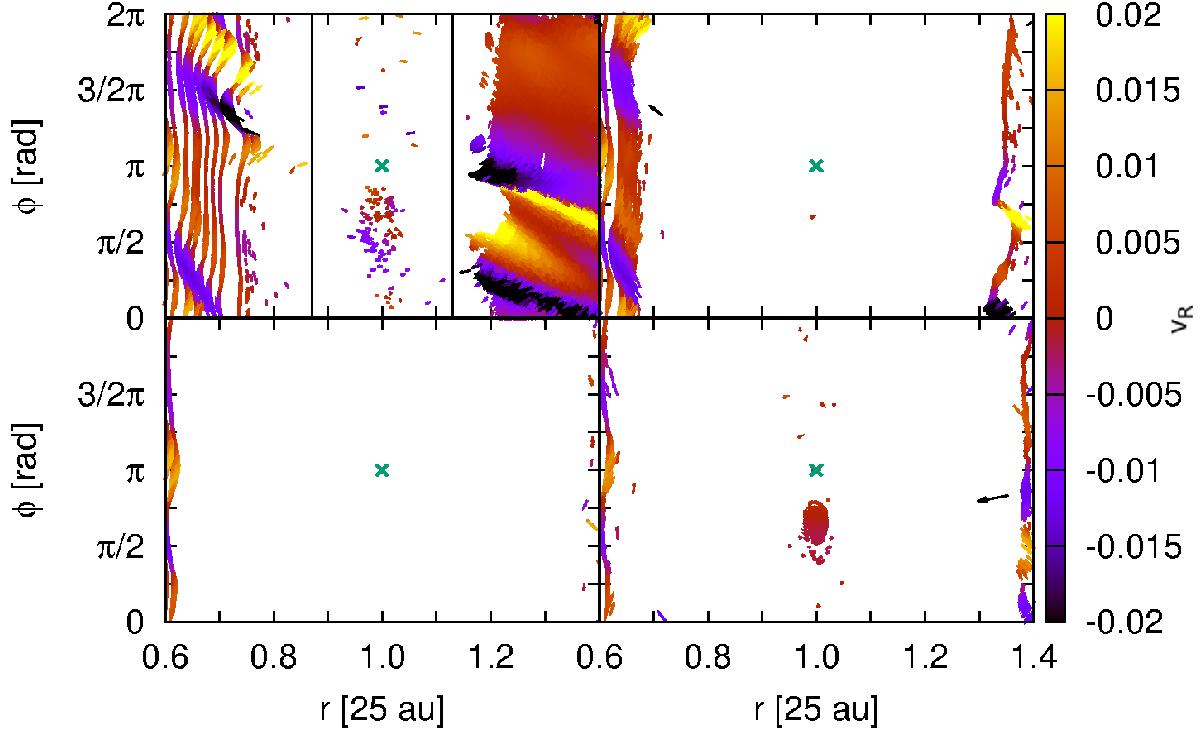
Particle distribution near the inner intermediate mass planetary core location for mm- (top left), cm- (top right), dm- (bottom left) and m-sized (bottom right) particles at the end of the simulation. The velocity vectors of the particles with respect to the planet are shown and the colour scale shows the relative radial velocity.
Current usage metrics show cumulative count of Article Views (full-text article views including HTML views, PDF and ePub downloads, according to the available data) and Abstracts Views on Vision4Press platform.
Data correspond to usage on the plateform after 2015. The current usage metrics is available 48-96 hours after online publication and is updated daily on week days.
Initial download of the metrics may take a while.