Fig. 7
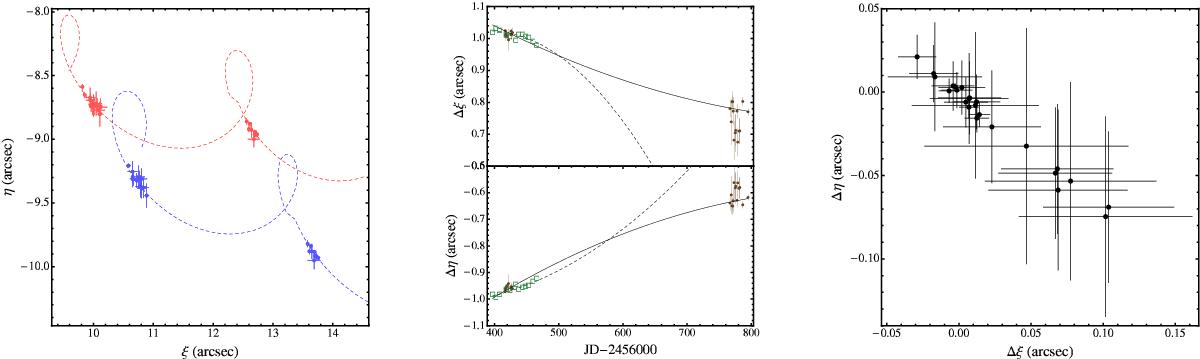
Left panel: absolute positions, { ξ,η }, of the components A and B of the binary system Luhman 16, estimated from the data taken with the LI camera mounted on the Danish 1.54 m Telescope over two seasons. Points marked in red (blue) are from Luhman 16A (16B). Dashed lines represent the best model fits to the data with the models (for the primary and for the secondary) as described in Sect. 3.2. Middle panel: relative positions of the A component with respect to the B component of the binary system Luhman 16 as a function of time. Brown points are those estimated with the Danish Telescope over two seasons, while the open boxes refer to the measurements of Boffin et al. (2014; the size of their error bars is lower than the size of the boxes, and they were suppressed for clarity). Solid lines represent the best parabolic fits of both the data sets, while the dashed lines are the fits based on the prediction from Boffin et al. (2014). Right panel: residuals of the LI camera data based on the parabolic fit.
Current usage metrics show cumulative count of Article Views (full-text article views including HTML views, PDF and ePub downloads, according to the available data) and Abstracts Views on Vision4Press platform.
Data correspond to usage on the plateform after 2015. The current usage metrics is available 48-96 hours after online publication and is updated daily on week days.
Initial download of the metrics may take a while.