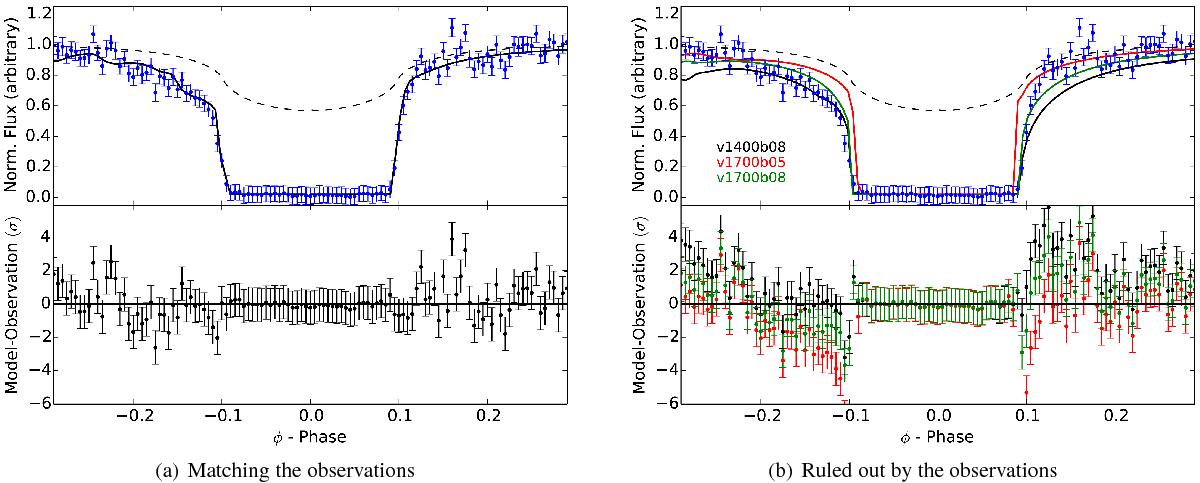
Fig. 5

Swift/BAT 14–100 keV energy range folded lightcurves of Vela X-1 (blue points), together with the simulated eclipse profiles (dashed lines) using a binary separation α = 1.77 R∗. Left: the lightcurves corrected for scattering (solid line) were built assuming wind terminal velocity of υ∞ = 1400 and β = 0.5. Right: same as previously for the remaining models, vXXXXbYY, where XXXX is the wind terminal velocity in km s-1 and YY is the wind β parameter. The residuals between the model and observations are shown in the bottom panel. The χ2 are listed in Table 2.
Current usage metrics show cumulative count of Article Views (full-text article views including HTML views, PDF and ePub downloads, according to the available data) and Abstracts Views on Vision4Press platform.
Data correspond to usage on the plateform after 2015. The current usage metrics is available 48-96 hours after online publication and is updated daily on week days.
Initial download of the metrics may take a while.


