Free Access
Fig. 3
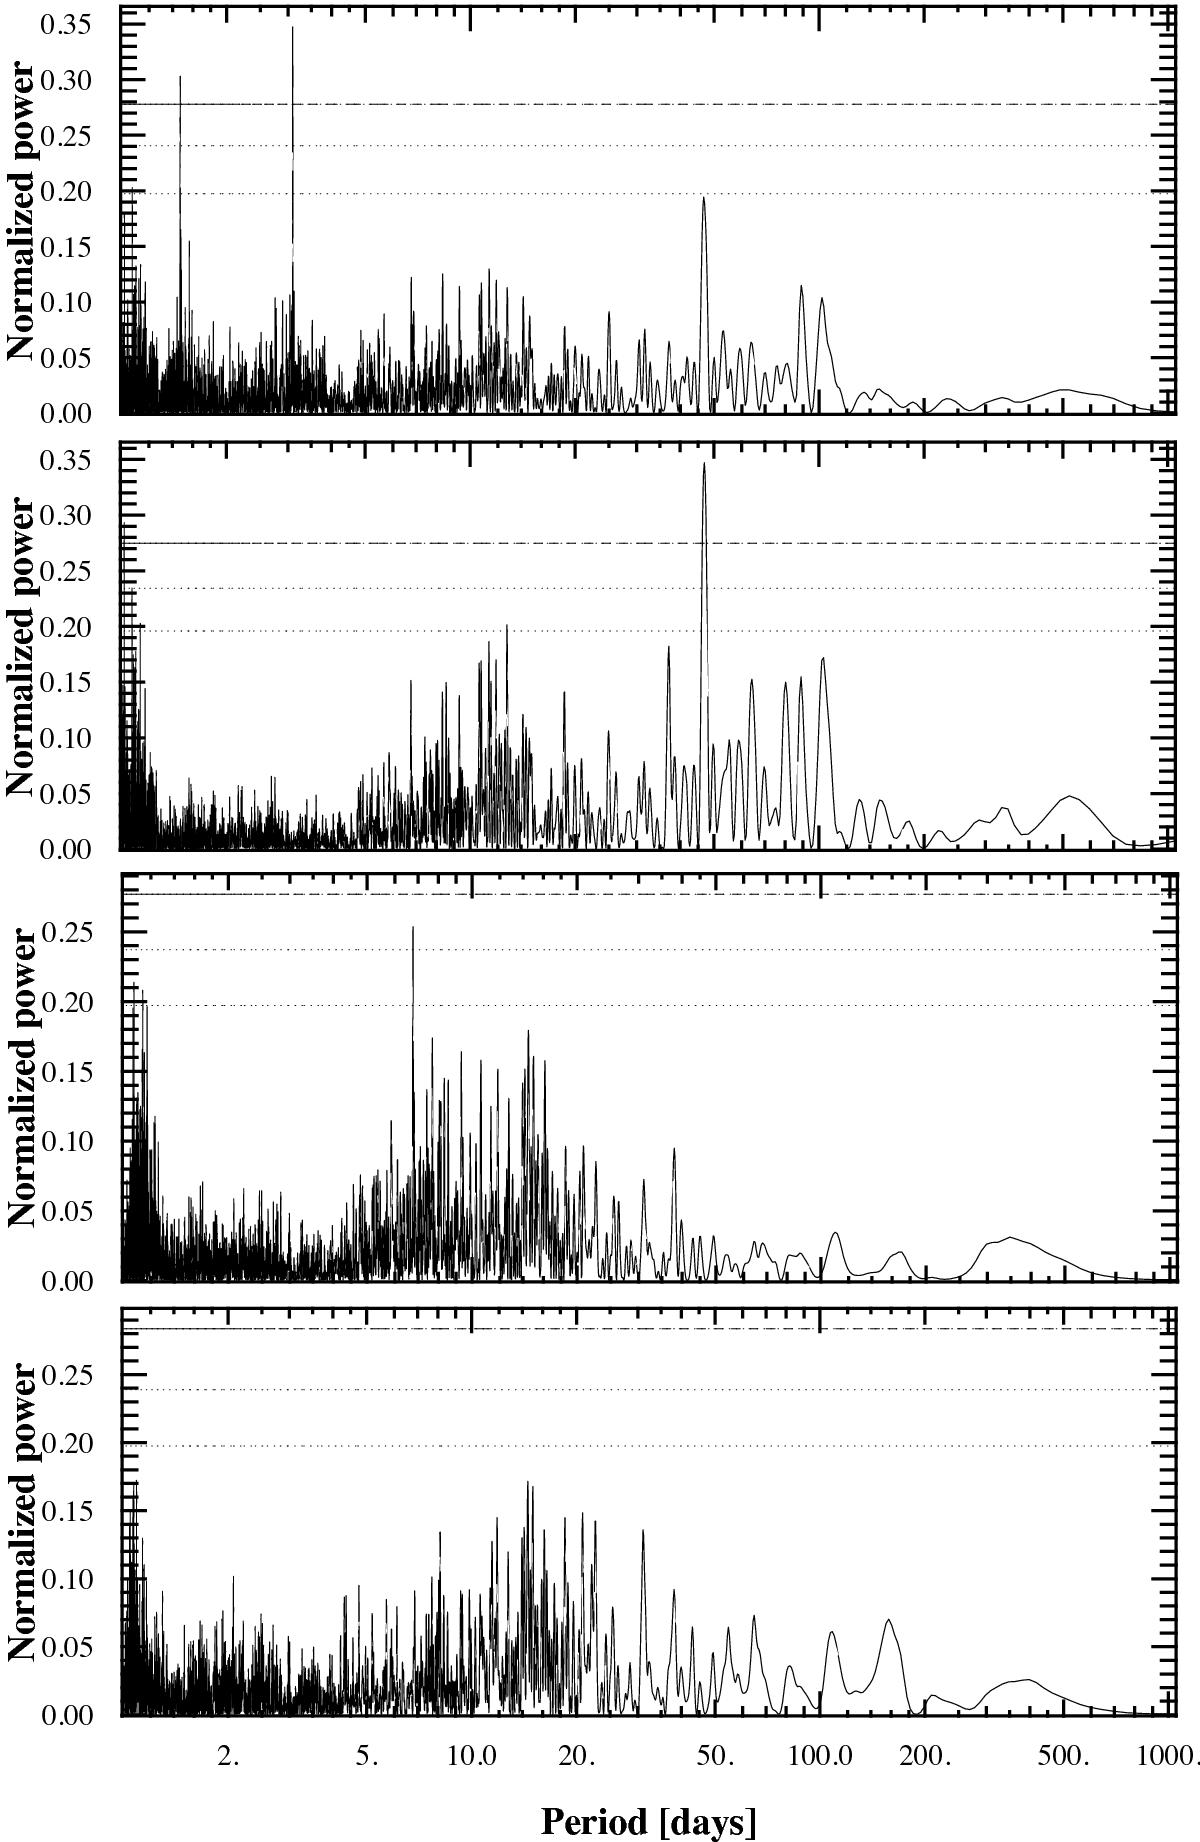
Generalized Lomb-Scargle periodogram of the radial velocities of HD 219134, after removing – from top to bottom – a long-period Keplerian, and successively the 3.09-day, the 46.66-day and finally the 6.76-day signals. Dashed lines indicate 0.1%, 1%, and 10% levels of false alarm probability.
This figure is made of several images, please see below:
Current usage metrics show cumulative count of Article Views (full-text article views including HTML views, PDF and ePub downloads, according to the available data) and Abstracts Views on Vision4Press platform.
Data correspond to usage on the plateform after 2015. The current usage metrics is available 48-96 hours after online publication and is updated daily on week days.
Initial download of the metrics may take a while.