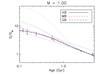
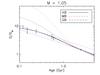
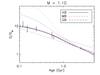
Fig. 6
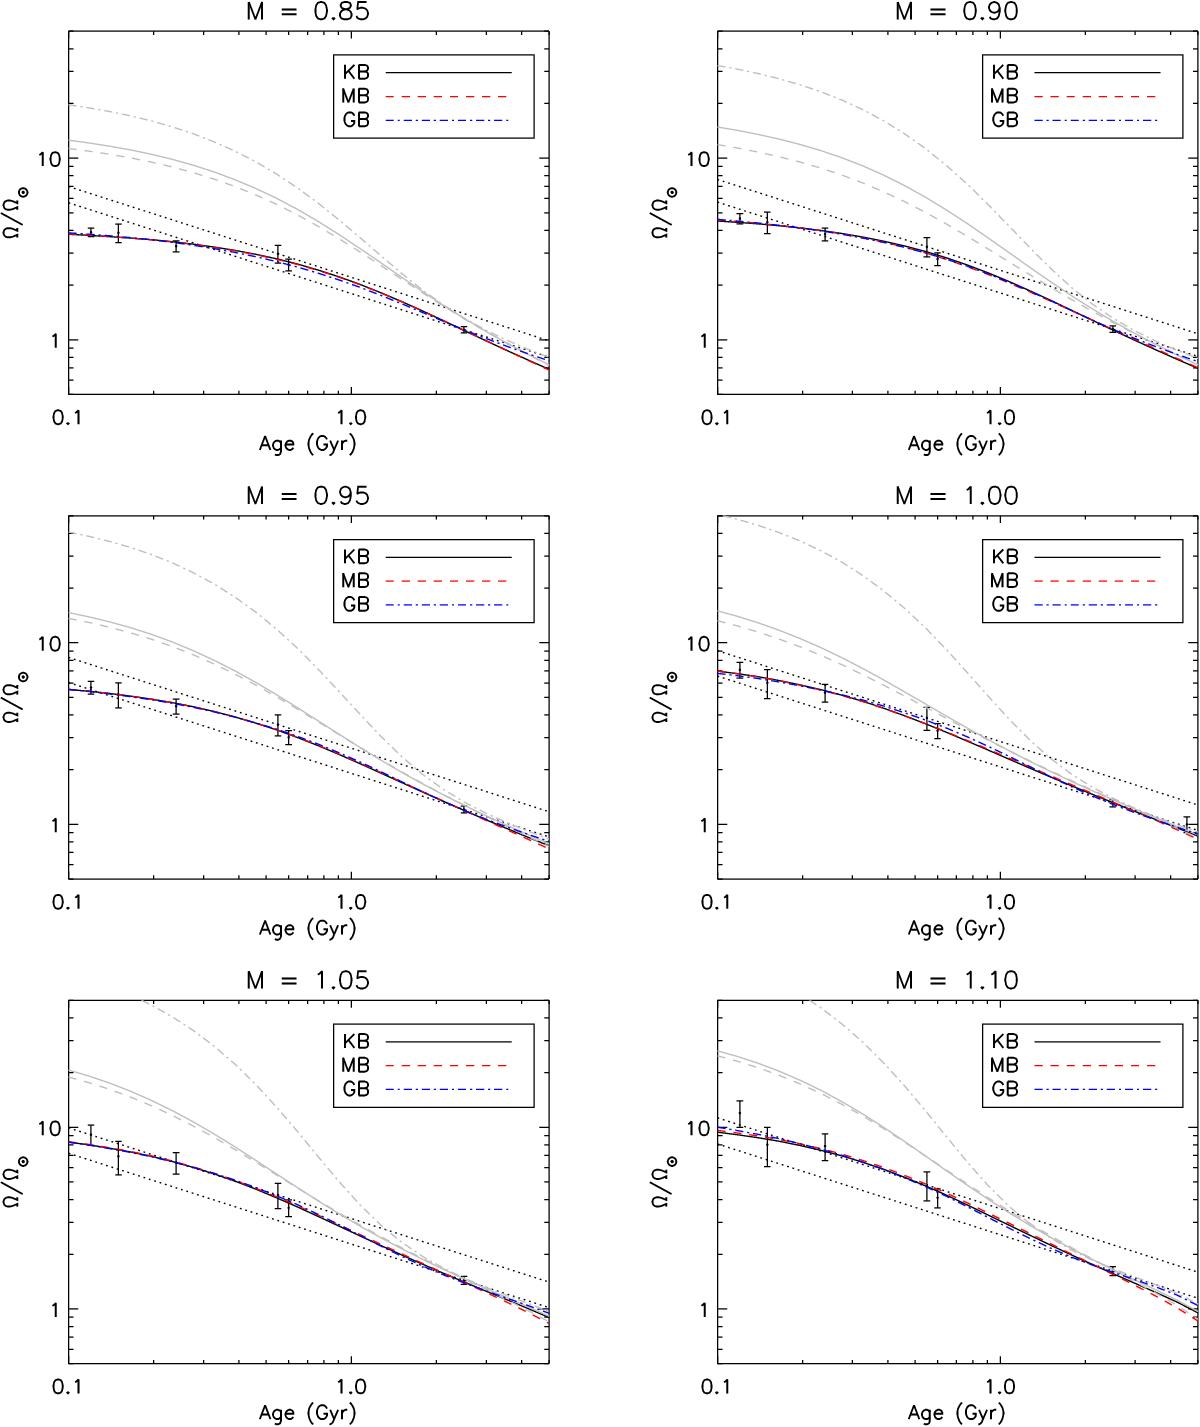
Comparison of the stellar envelope angular velocity evolution according to models KB (black solid line), MB (red dashed line), and GB (blue dot-dashed line) with observations. Mass scaling is corrected according to the MCMC fit for all models. The corresponding core angular velocity for each model is reported in gray with the same line style as for the envelope angular velocity. Dotted lines represent Eq. (19)(Skumanich law) with t0 = 0.55 and t0 = 2.50.
Current usage metrics show cumulative count of Article Views (full-text article views including HTML views, PDF and ePub downloads, according to the available data) and Abstracts Views on Vision4Press platform.
Data correspond to usage on the plateform after 2015. The current usage metrics is available 48-96 hours after online publication and is updated daily on week days.
Initial download of the metrics may take a while.