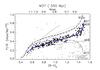
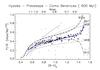
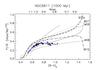
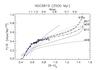
Fig. 1
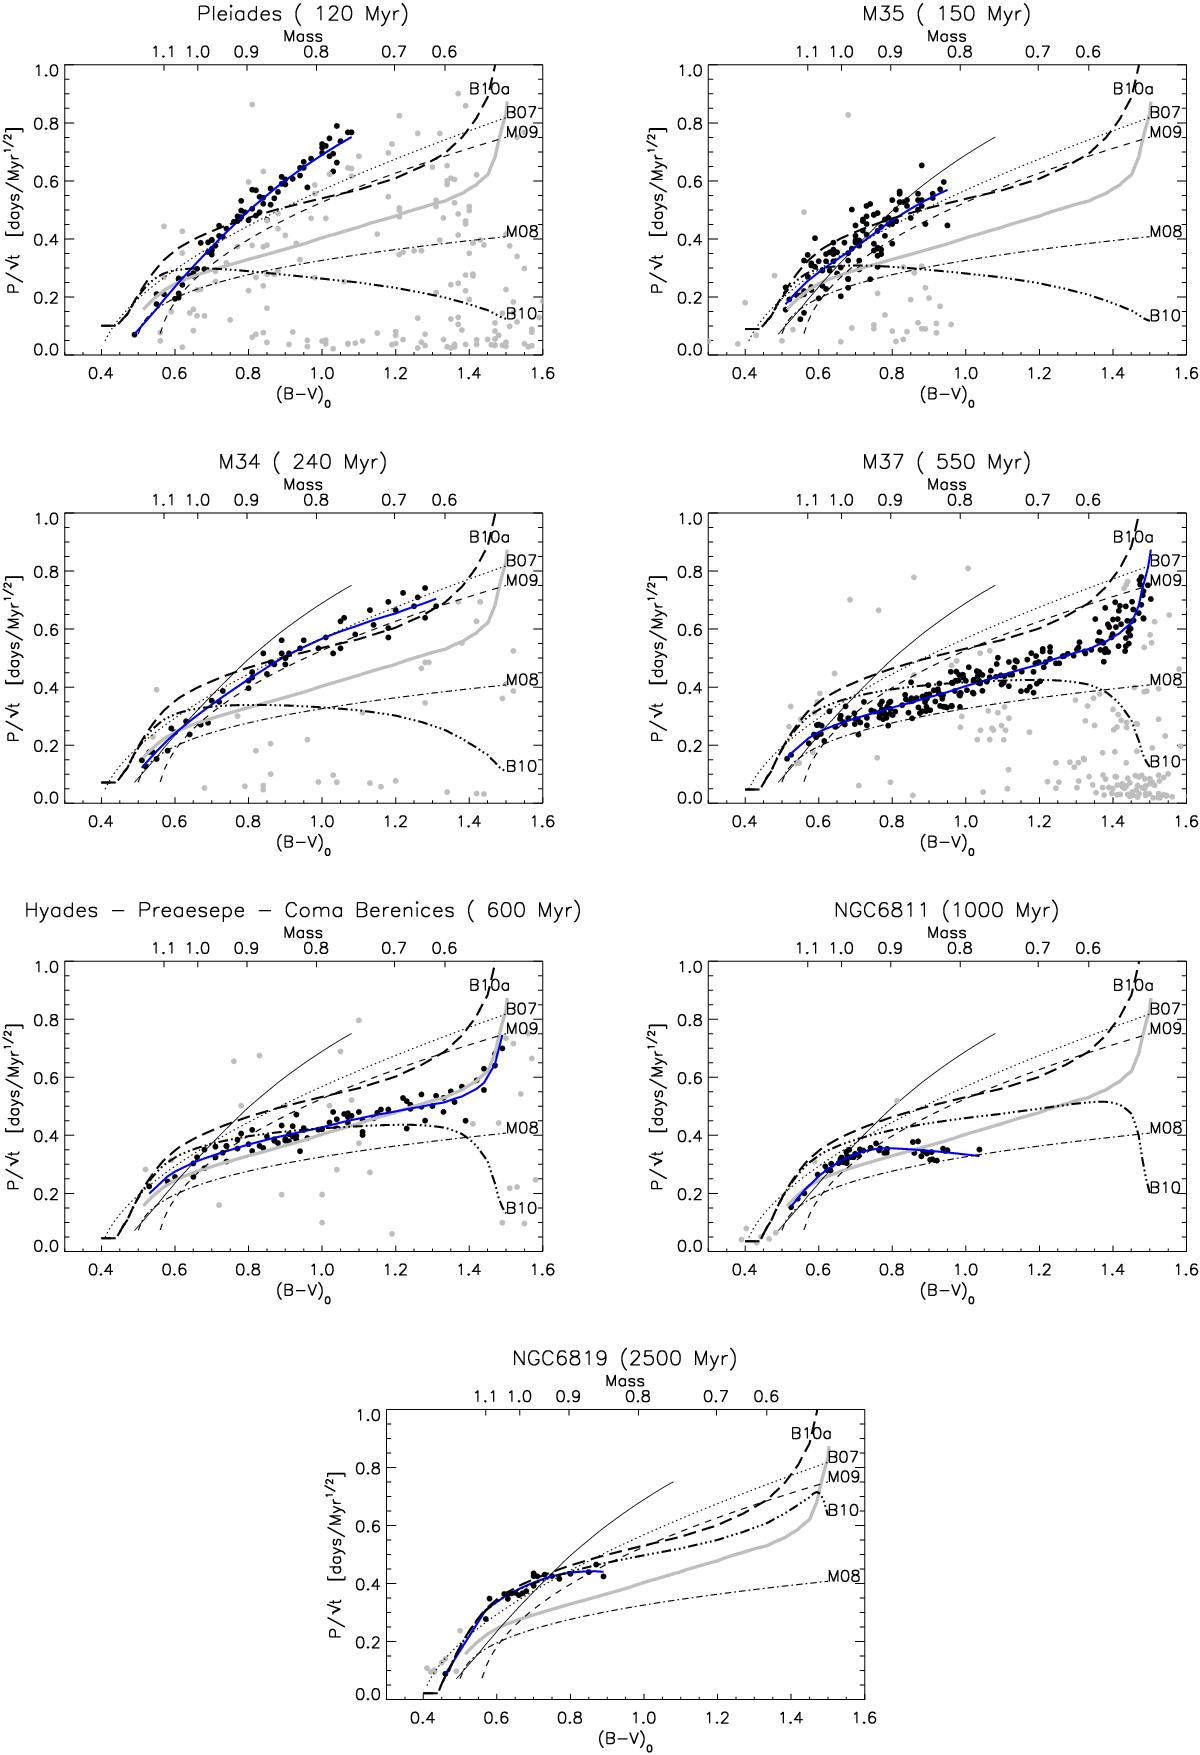
Rotation period scaled to the square root of age (in Myr) vs. (B−V). Periods of stars defining the slow-rotator sequence are represented with black dots, all others with gray dots. Our non-parametric fit of the slow-rotator sequence is shown as blue thick solid lines, with the Pleiades and M37 fits repeated in all panels as reference (black thin solid line and gray thick solid line respectively). The dotted line represent the f(B−V) function of Barnes (2007; B07), the dashed line that of Meibom et al. (2009; M09), the dot-dashed that of Mamajek & Hillenbrand (2008; M08), the dash-triple-dotted line the inverted Barnes (2010) relationship (Eq. (2), B10), the long-dashed line the Barnes (2010) asymptotic slow-rotator sequence limit (Eq. (3), B10a).
Current usage metrics show cumulative count of Article Views (full-text article views including HTML views, PDF and ePub downloads, according to the available data) and Abstracts Views on Vision4Press platform.
Data correspond to usage on the plateform after 2015. The current usage metrics is available 48-96 hours after online publication and is updated daily on week days.
Initial download of the metrics may take a while.