Fig. 3
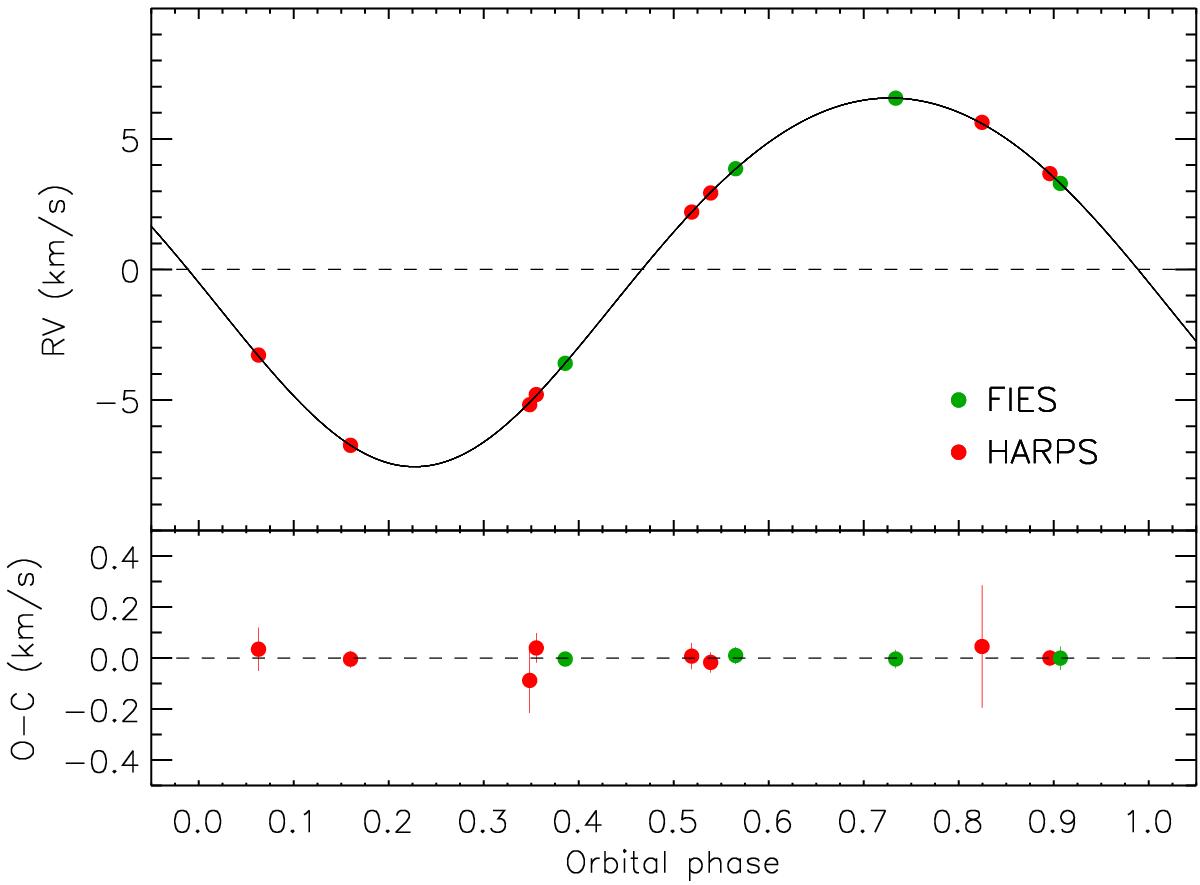
Upper panel: phase-folded RV measurements of CoRoT-33. Red circles represent the HARPS-measurements while green circles are the data points obtained by FIES-instrument. Black solid line represents the eccentric orbit fit. The RV points and the fit is shifted by the γ-velocity of the system. Lower panel: it shows the residuals of the fit. Vertical lines on the data points indicate their error bars.
Current usage metrics show cumulative count of Article Views (full-text article views including HTML views, PDF and ePub downloads, according to the available data) and Abstracts Views on Vision4Press platform.
Data correspond to usage on the plateform after 2015. The current usage metrics is available 48-96 hours after online publication and is updated daily on week days.
Initial download of the metrics may take a while.