Fig. 1
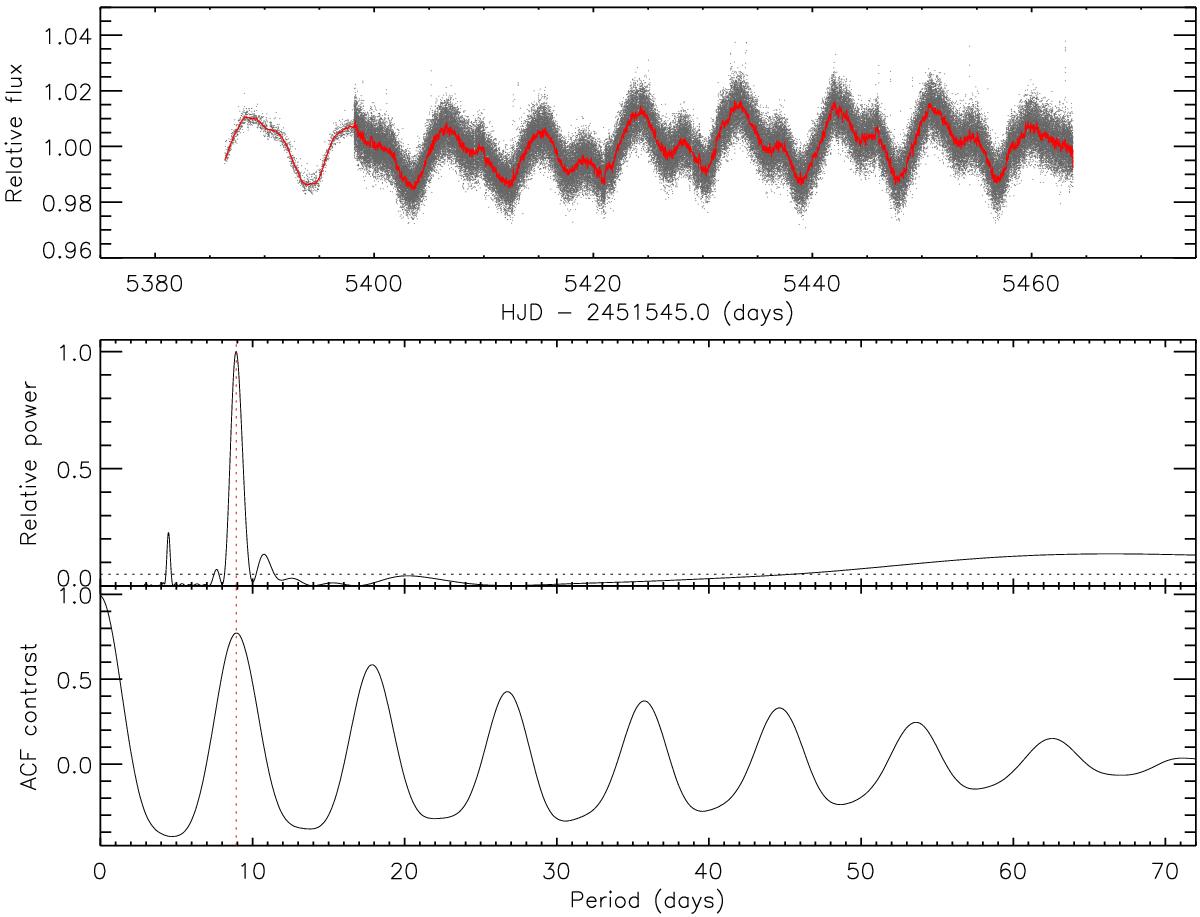
Upper panel: full CoRoT light curve of CoRoT-33. The gray points represent the median-normalized raw data points after a 5-point width median filtering. We only used data points with flag “0” for this curve. The red line is a convolution of the raw light curve with a Savitzky-Golay filter that enhances the light-curve variations. Middle panel: Lomb-Scargle periodogram of the light curve of CoRoT-33. The horizontal dashed line denotes the 0.01% false-alarm probability (Scargle 1982). The vertical red line marks the rotation period of the star. Lower panel: autocorrelation function (ACF) of light curve, following the subtraction of the best fitting transit model. The red dashed line marks the peak corresponding to the rotation period of CoRoT-33 (see Sect. 3.5).
Current usage metrics show cumulative count of Article Views (full-text article views including HTML views, PDF and ePub downloads, according to the available data) and Abstracts Views on Vision4Press platform.
Data correspond to usage on the plateform after 2015. The current usage metrics is available 48-96 hours after online publication and is updated daily on week days.
Initial download of the metrics may take a while.