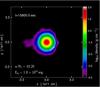
Fig. 13
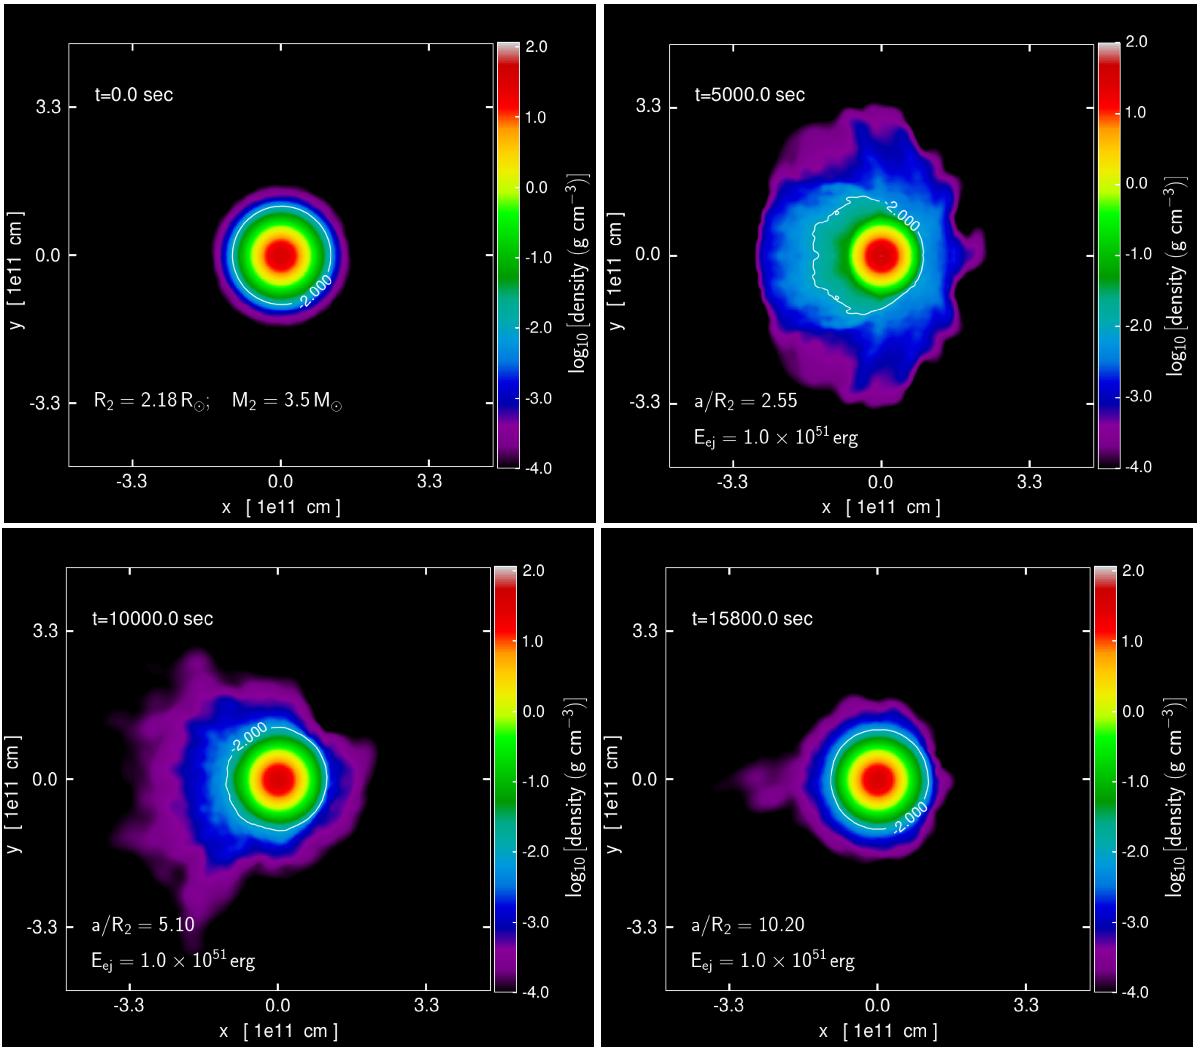
Density distribution simulations of the companion star using a 3.5 M⊙ B-star MS model with different initial binary separations. Only the bound material that originally belonged to the companion star and final accreted ejecta are shown. The logarithm of density is color-coded. The top-left panel shows the initial configuration for all three cases. The motion of the incoming SN ejecta is from right to left. The following three panels (for initial orbital separations of a/R2 = 2.55, 5.10 and 10.20, respectively) show snapshots of the mass density at the moment that the removed companion mass, the resulting impact velocity, and the contamination from the SN ejecta, have converged to (almost) constant values. In the widest system (lower-left panel), the impacted star is not significantly inflated compared to its initial state before the SN impact. The white curves show constant density contours (log10ρ = −2.0).
Current usage metrics show cumulative count of Article Views (full-text article views including HTML views, PDF and ePub downloads, according to the available data) and Abstracts Views on Vision4Press platform.
Data correspond to usage on the plateform after 2015. The current usage metrics is available 48-96 hours after online publication and is updated daily on week days.
Initial download of the metrics may take a while.