Free Access
Fig. 2
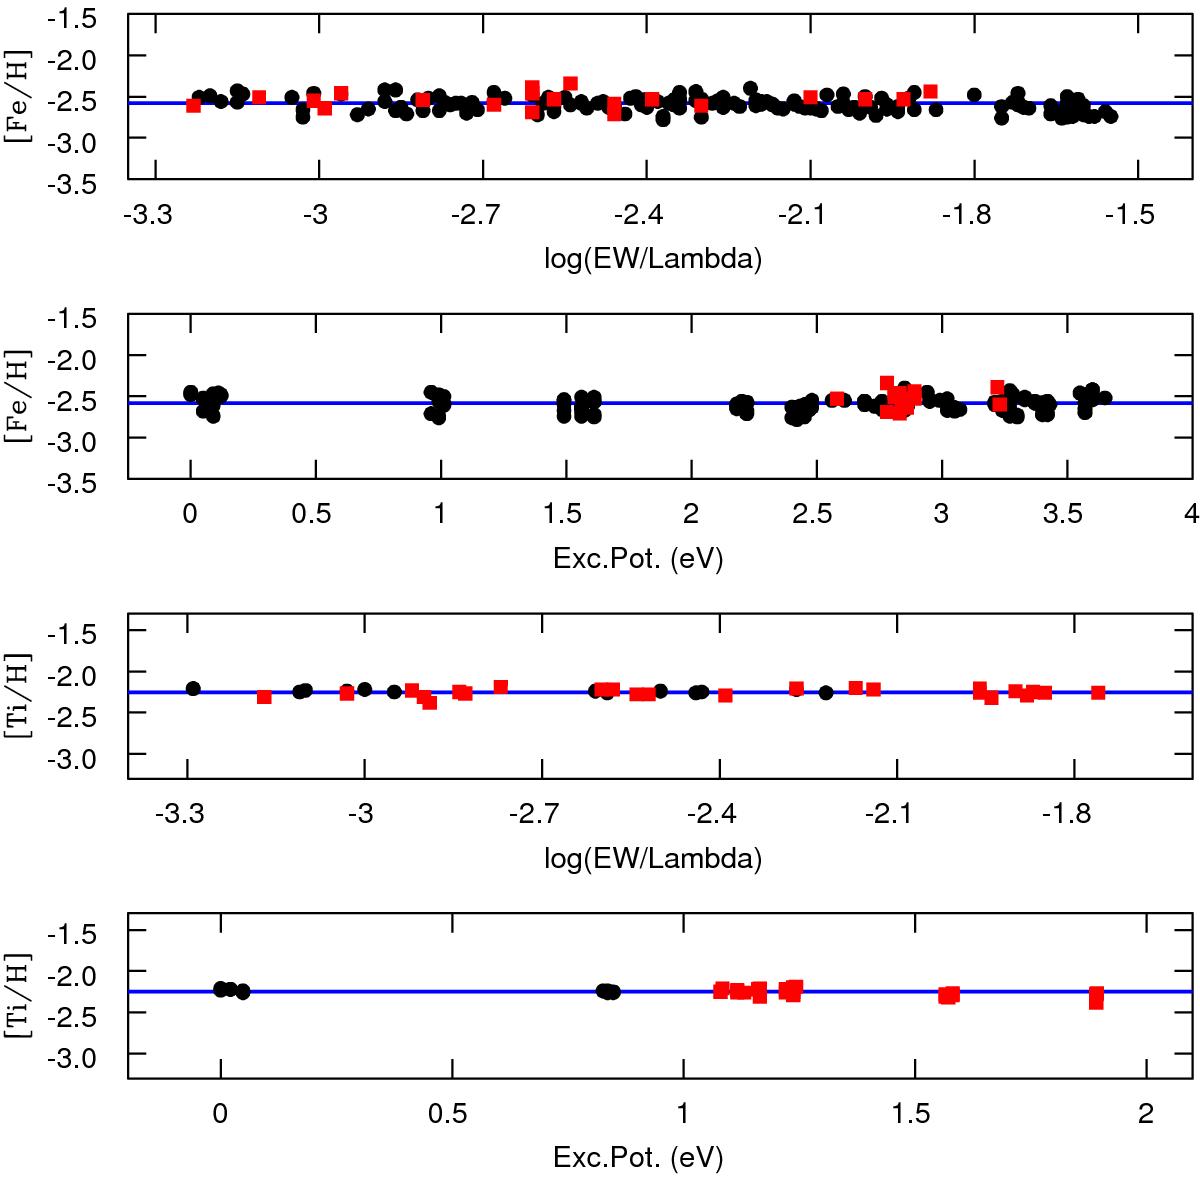
Excitation and ionization equilibria of Fe and Ti lines, resulting from the set of atmospheric parameters for HD 140283. The black dots are the abundances obtained from Ti i and Fe i lines, the red squares are those from Ti ii and Fe ii lines, and the blue solid lines represent the average abundances.
Current usage metrics show cumulative count of Article Views (full-text article views including HTML views, PDF and ePub downloads, according to the available data) and Abstracts Views on Vision4Press platform.
Data correspond to usage on the plateform after 2015. The current usage metrics is available 48-96 hours after online publication and is updated daily on week days.
Initial download of the metrics may take a while.