Fig. 4
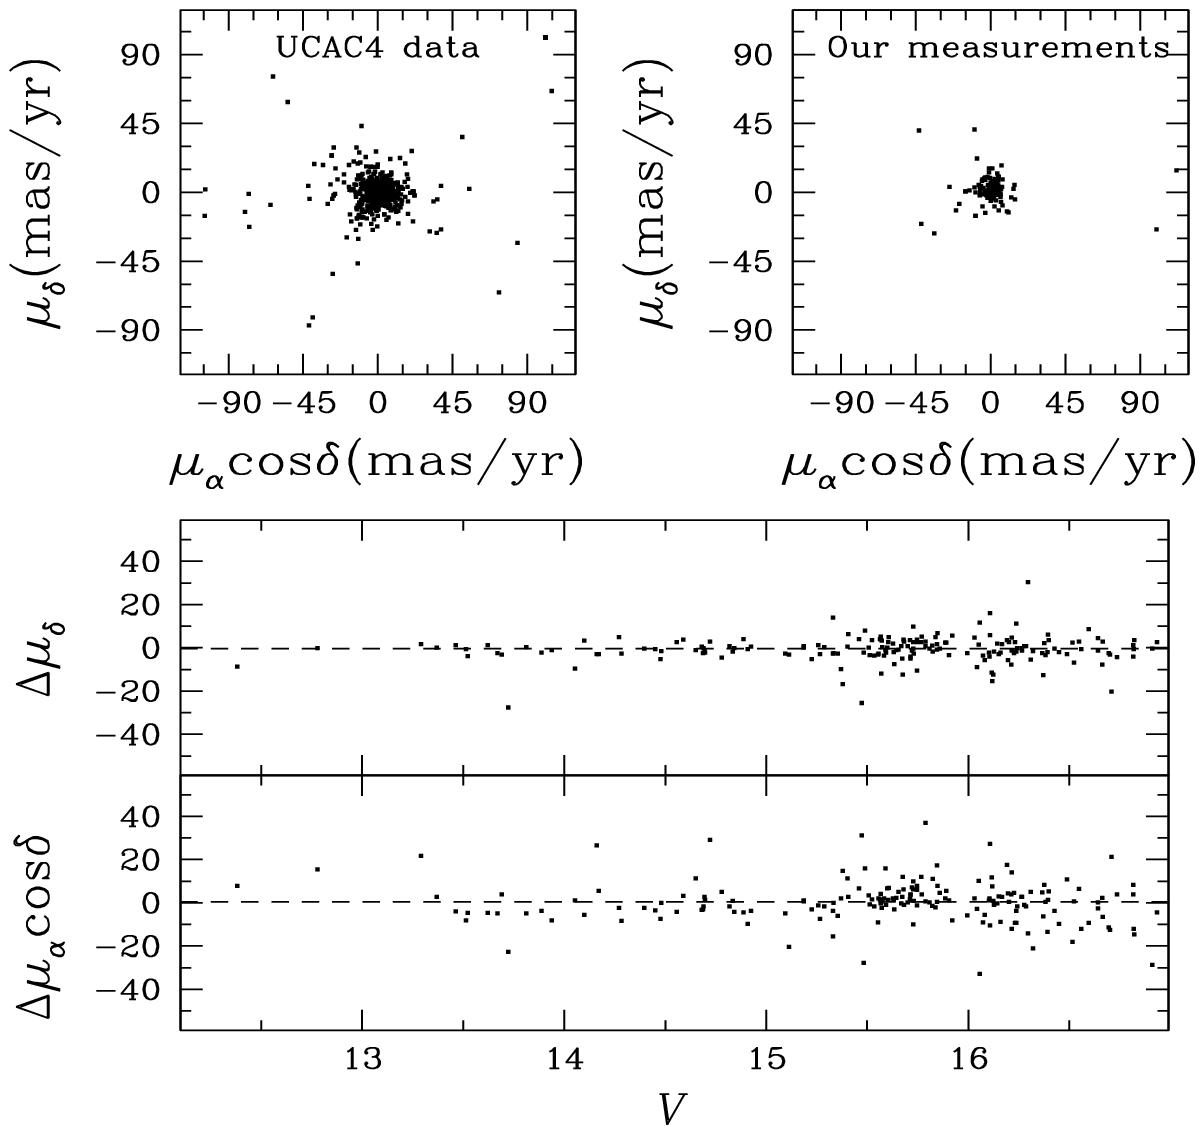
Top panels: vector-point diagrams of common stars relative to the cluster mean motion for UCAC4 (left) and our measurements (right). Bottom panels: right ascension (bottom) and declination (top) proper motion differences as a function of V magnitude between UCAC4 and our measurements. Horizontal dashed lines show the 3σ-clipped median of the proper motion difference between UCAC4 and our data.
Current usage metrics show cumulative count of Article Views (full-text article views including HTML views, PDF and ePub downloads, according to the available data) and Abstracts Views on Vision4Press platform.
Data correspond to usage on the plateform after 2015. The current usage metrics is available 48-96 hours after online publication and is updated daily on week days.
Initial download of the metrics may take a while.