Free Access
Fig. 17
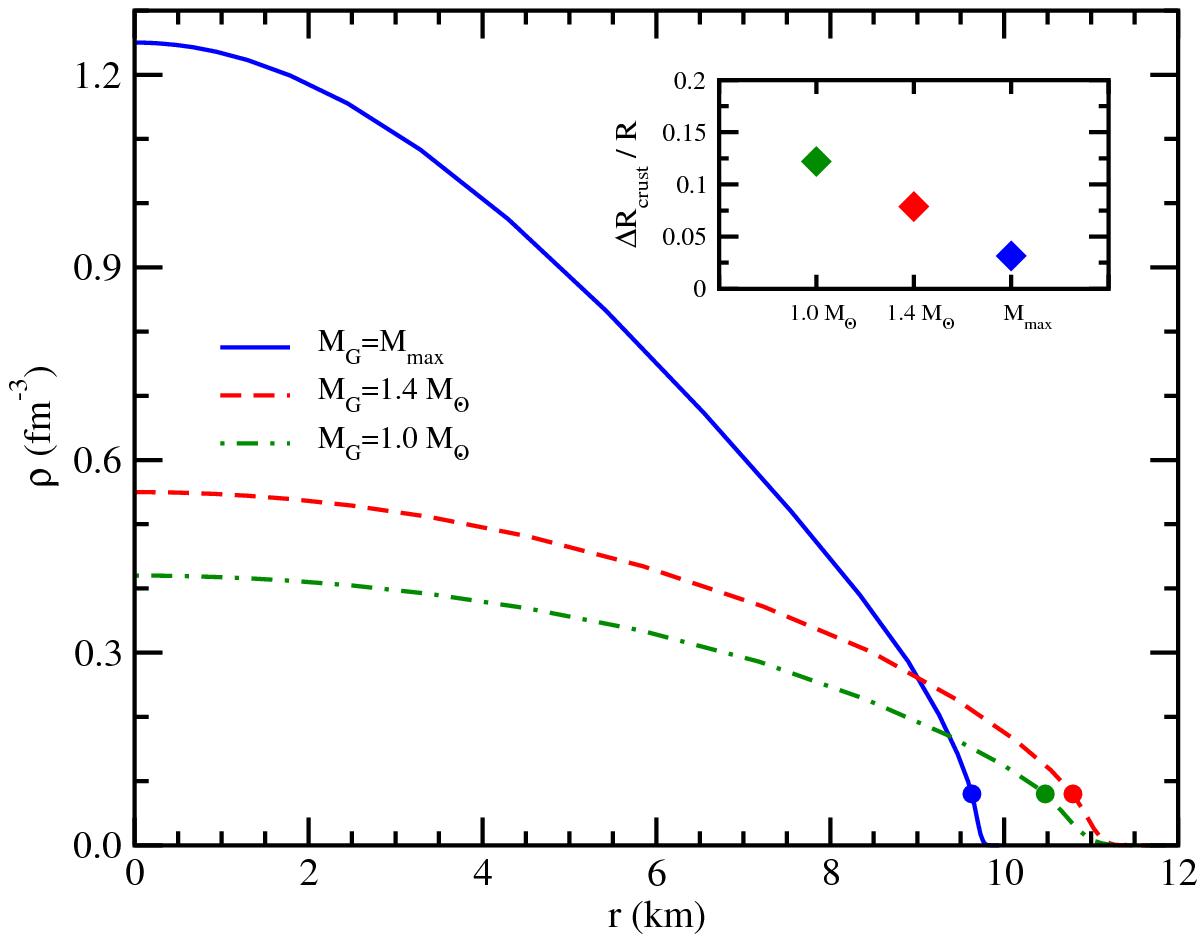
Density profiles for fixed mass configurations, i.e. MG = Mmax (solid blue curve), MG = 1.4 M⊙ (dashed red curve), and MG = 1.0 M⊙ (dot-dashed green curve). Full dots indicate the onset of the crust. In the inset the crust thickness is displayed for each fixed gravitational mass. See text for details.
Current usage metrics show cumulative count of Article Views (full-text article views including HTML views, PDF and ePub downloads, according to the available data) and Abstracts Views on Vision4Press platform.
Data correspond to usage on the plateform after 2015. The current usage metrics is available 48-96 hours after online publication and is updated daily on week days.
Initial download of the metrics may take a while.