Fig. 7
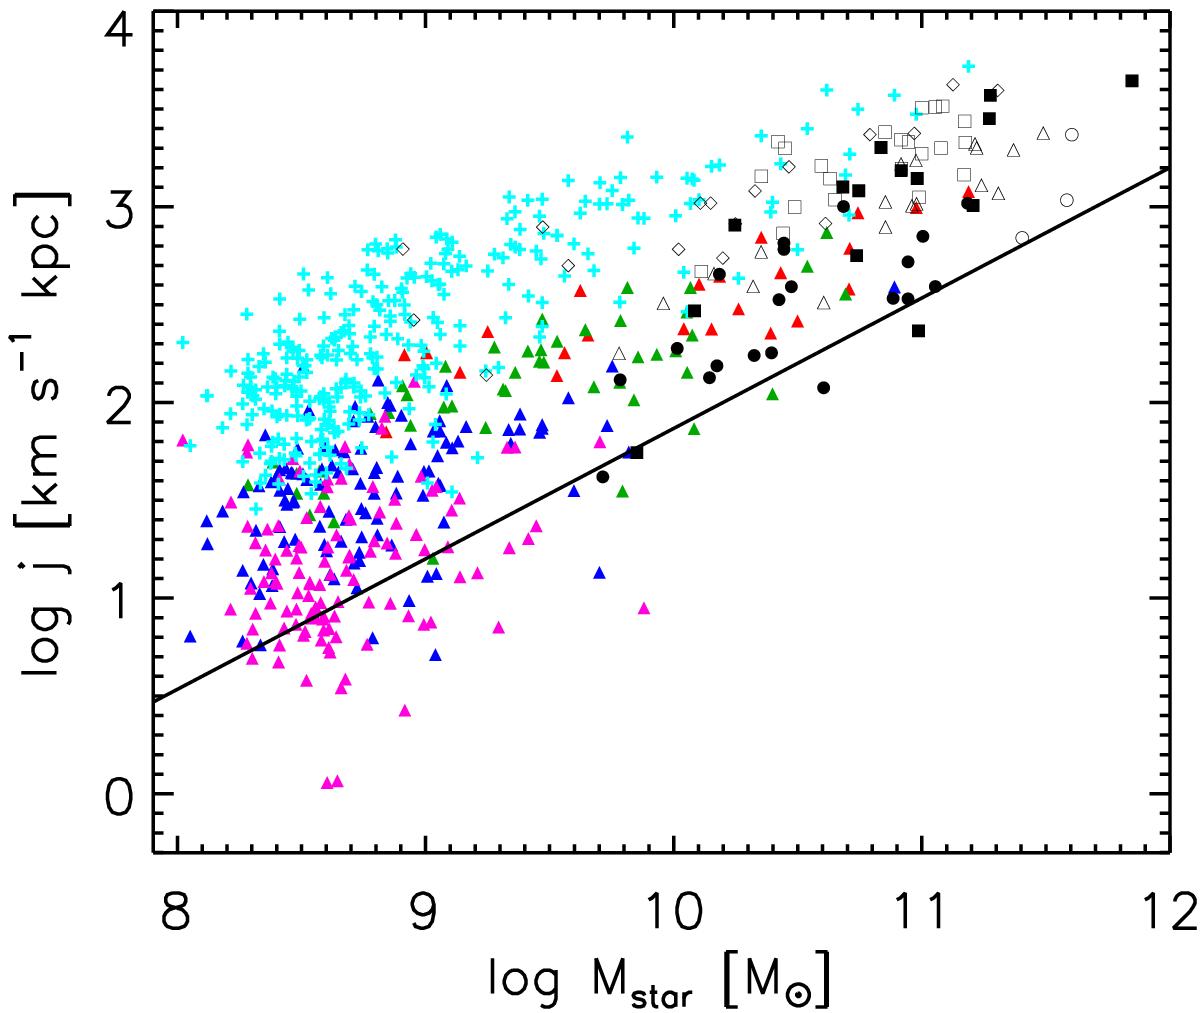
Relation between j and the total stellar mass for simulated galaxies with different disc-to-bulge ratios: D/T> 0.6 (red filled triangles), 0.4 <D/T< 0.6 (green filled triangles), 0.4 <D/T< 0.2 (blue filled triangles), and D/T< 0.2 (pink filled triangles) calculated at the galaxy radius. The relation for the gaseous discs are also included (cyan crosses). The observational estimations reported by Fall & Romanowsky (2013) are depicted for comparison: Sa-Sab (black triangles), Sb-Sbc (black squares), Sc-Sm (black diamonds), E (black filled circles), S0 (black filled squares, and sE (black circles). The theoretical relation j ∝ M2/3 is also included (black continuous line).
Current usage metrics show cumulative count of Article Views (full-text article views including HTML views, PDF and ePub downloads, according to the available data) and Abstracts Views on Vision4Press platform.
Data correspond to usage on the plateform after 2015. The current usage metrics is available 48-96 hours after online publication and is updated daily on week days.
Initial download of the metrics may take a while.