Fig. 9
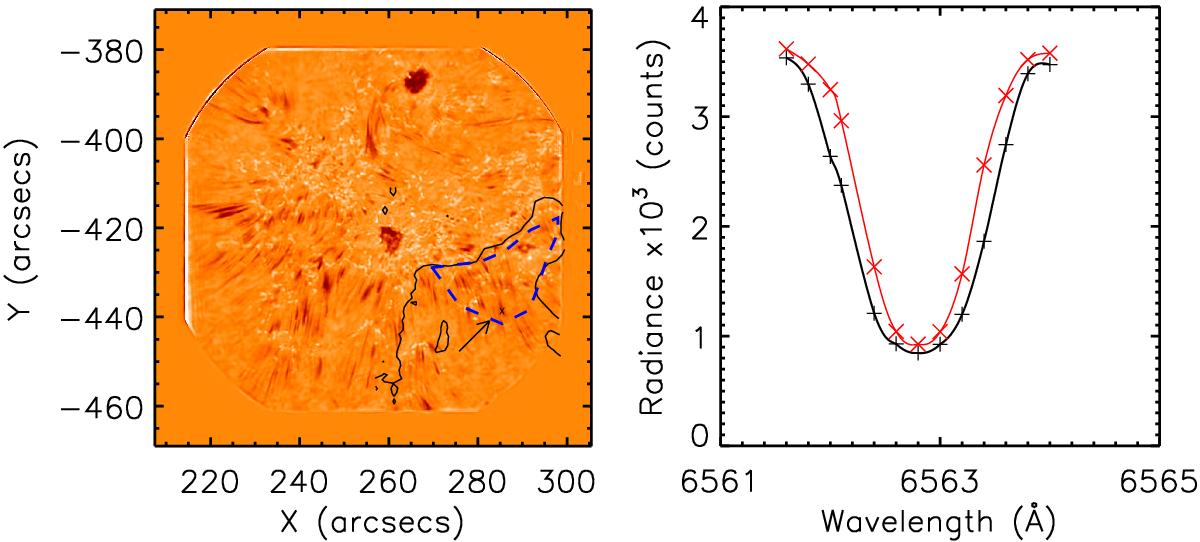
Left: full FOV of a speckle reconstructed IBIS image at −0.8 Å (−36 kms-1). The contour of the upflow region as derived from the EIS Doppler-shift image is superimposed in black. The dashed blue line is the contour of the footpoints of the upflow region. Right: average Hα line profile in red and in black the line profile of a single pixel in a jet (spicule or RBE) within the footpoints of the upflow region. The pixel is indicated with a cross in the left panel and pointed at with an arrow.
Current usage metrics show cumulative count of Article Views (full-text article views including HTML views, PDF and ePub downloads, according to the available data) and Abstracts Views on Vision4Press platform.
Data correspond to usage on the plateform after 2015. The current usage metrics is available 48-96 hours after online publication and is updated daily on week days.
Initial download of the metrics may take a while.