Fig. 8
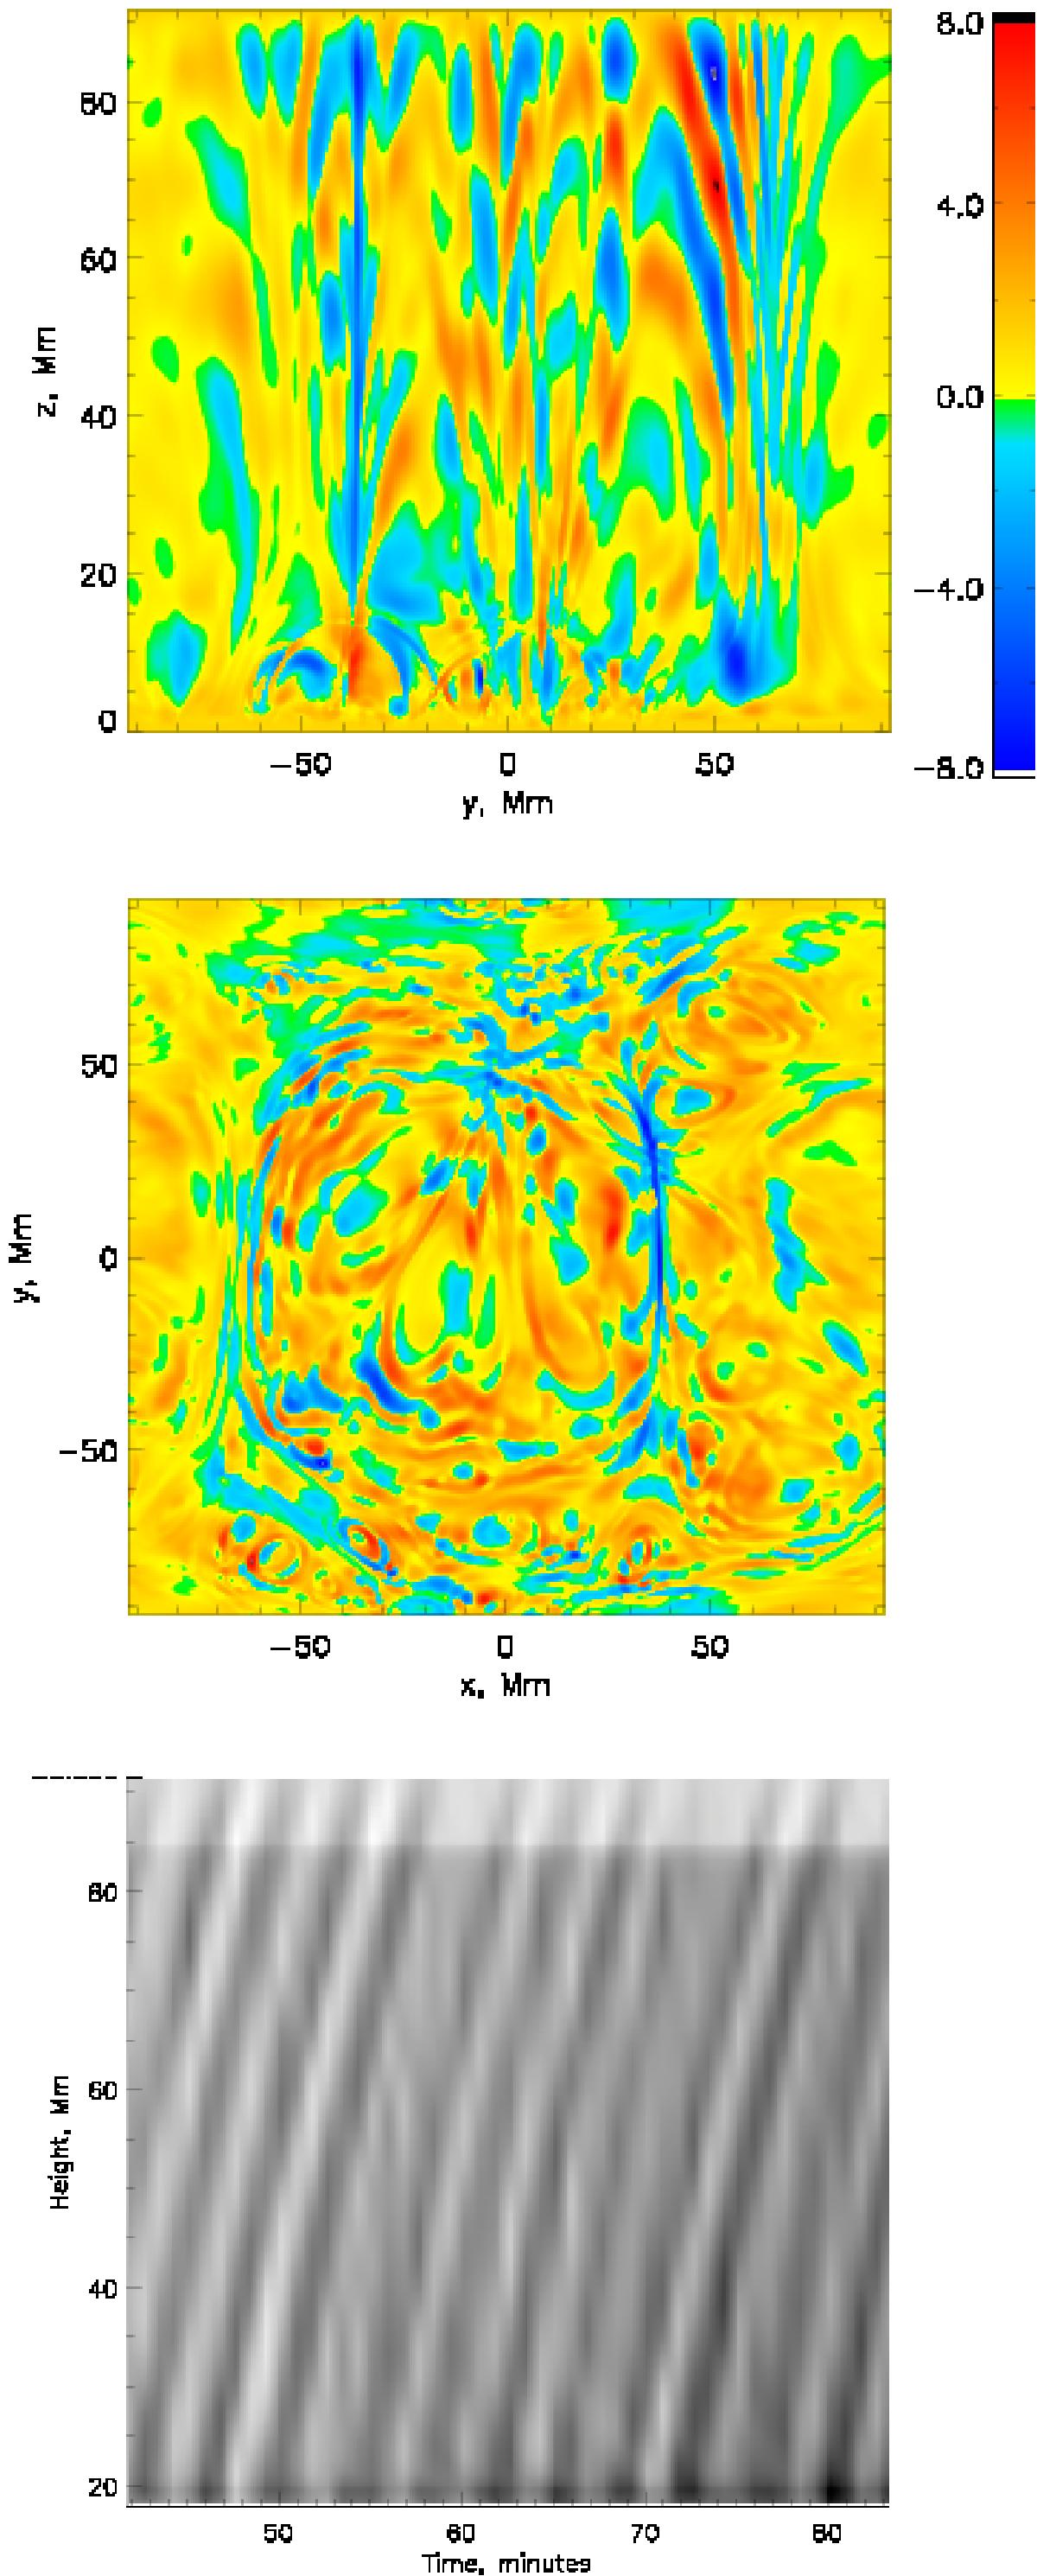
Top: representation of a vertical slice (y, z-plane) in the observed upflow region of the domain, showing the vertical flow speeds of ±8 km s-1. Middle: the same but for a horizontal plane (x, y plane inside the corona). Bottom: time slice of the density variation in height, showing how structures are moving upward in the atmosphere with a speed of roughly 150 km s-1. The plot also show the period of the oscillations is of the order of 3.7 min. The snapshots used for the top and middle frames represent t = 132.5 min.
Current usage metrics show cumulative count of Article Views (full-text article views including HTML views, PDF and ePub downloads, according to the available data) and Abstracts Views on Vision4Press platform.
Data correspond to usage on the plateform after 2015. The current usage metrics is available 48-96 hours after online publication and is updated daily on week days.
Initial download of the metrics may take a while.