Fig. 6
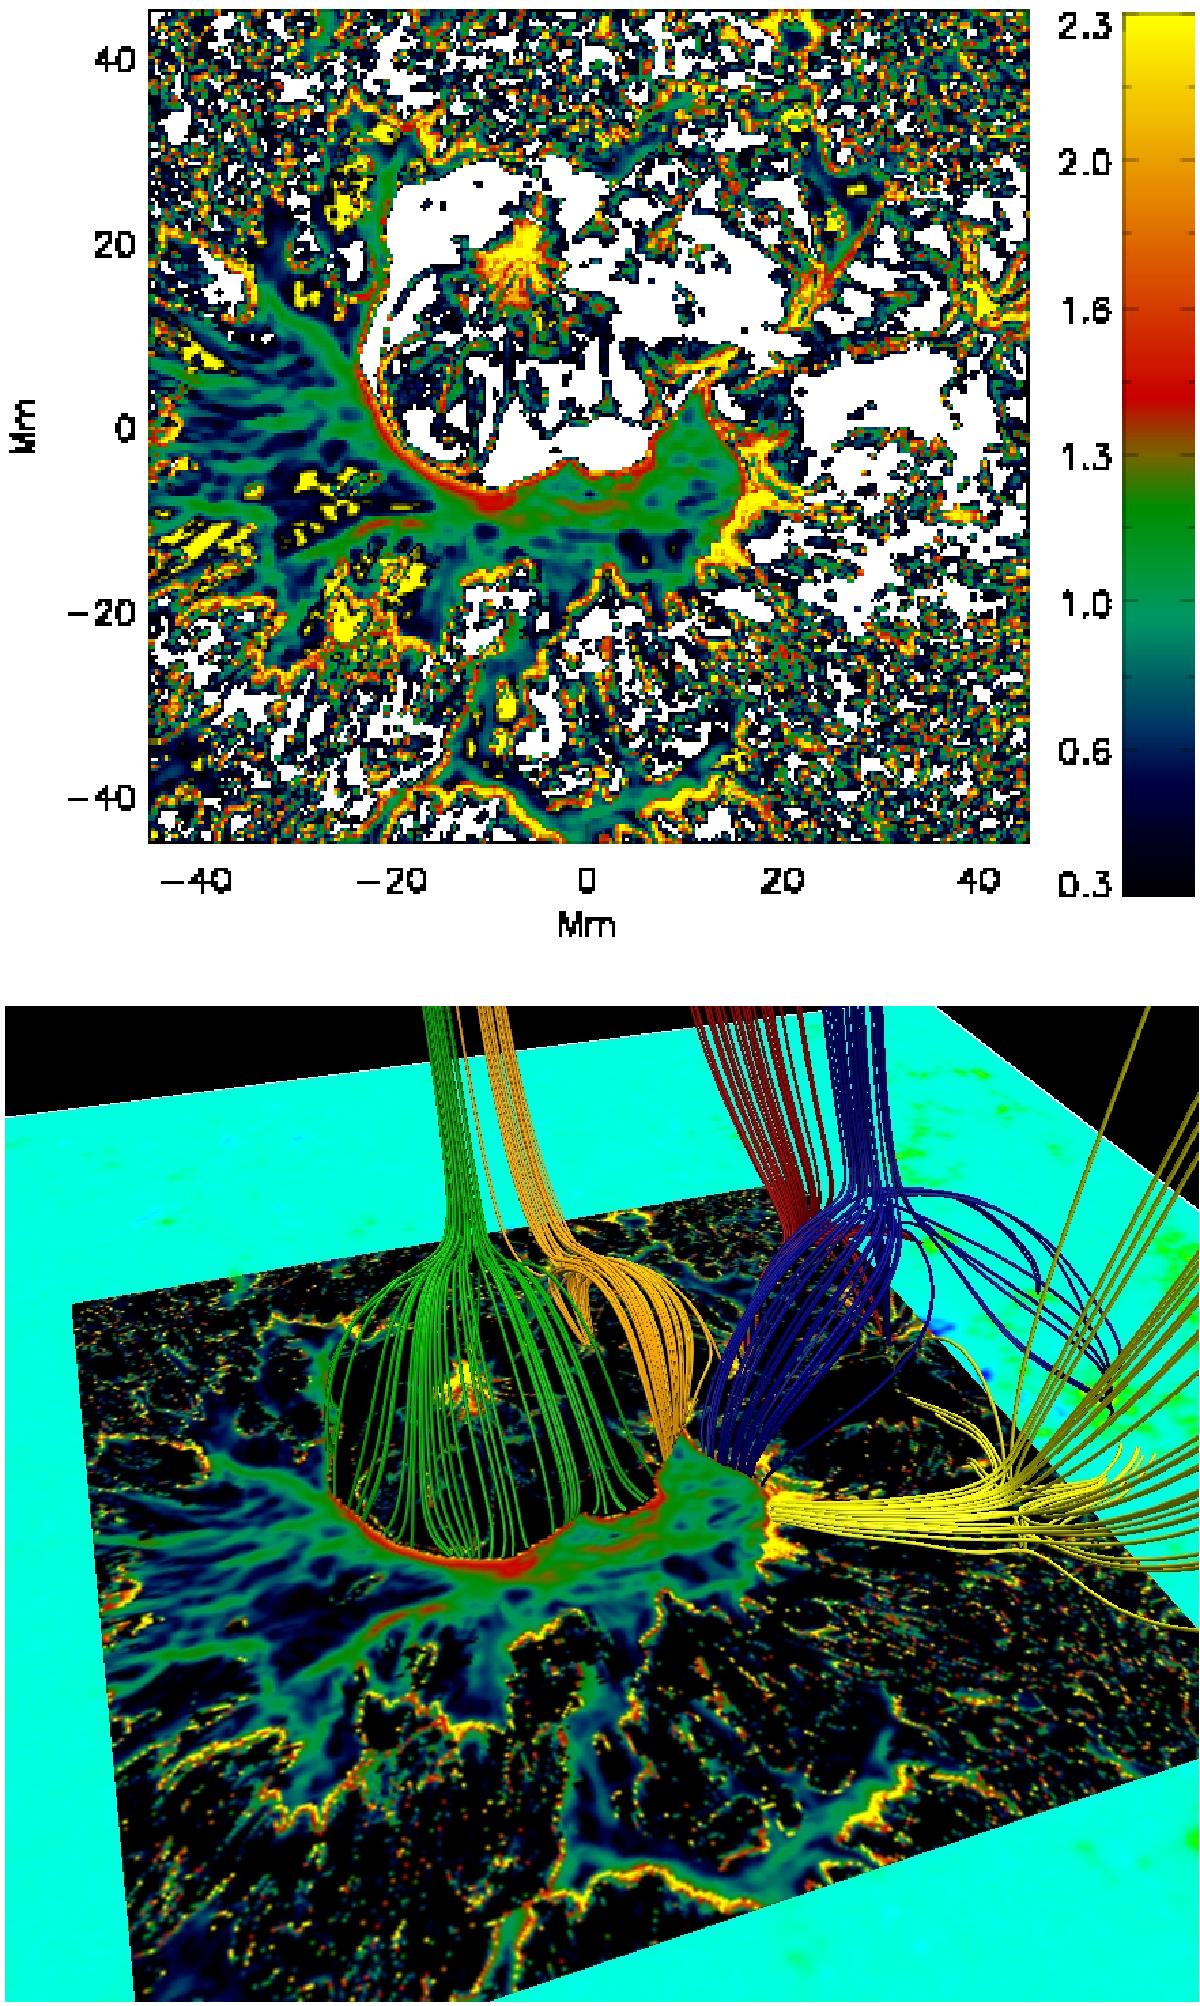
Top: quasi separator layer map indicating the locations of rapid changes in the field line mapping across the core region of the domain using the invariant measure defined by Titov (2007). The data represent ±45 Mm in the x and y around the centre of the domain. The data are logarithmically scaled over values from 2 to 1000. White areas have low values. Bottom: QSL map and its relation to the null points close to the active region.

Current usage metrics show cumulative count of Article Views (full-text article views including HTML views, PDF and ePub downloads, according to the available data) and Abstracts Views on Vision4Press platform.
Data correspond to usage on the plateform after 2015. The current usage metrics is available 48-96 hours after online publication and is updated daily on week days.
Initial download of the metrics may take a while.