Fig. 5
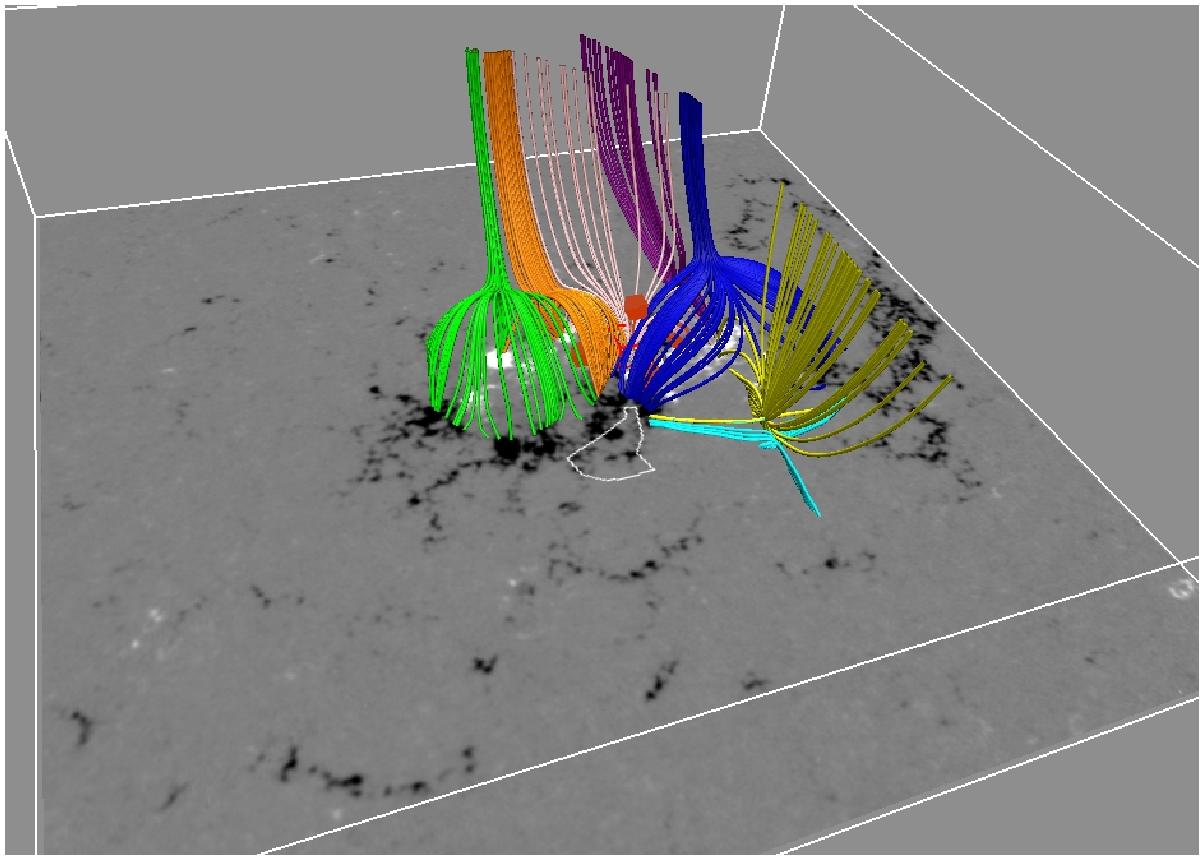
Representation of the initial magnetic field line topology. The different coloured field lines are traced from the vicinity of different null points, above the active region. These indicate the characteristic connectivity of the magnetic flux. The spatial orientation and size are comparable to Fig. 1. The base is the real magnetogram scaled to ±500 G. The white contour line in front of the footpoints of the magnetic field lines represents the footprints of the outflow region marked for a more detailed investigations in Fig. 6 in Paper I.
Current usage metrics show cumulative count of Article Views (full-text article views including HTML views, PDF and ePub downloads, according to the available data) and Abstracts Views on Vision4Press platform.
Data correspond to usage on the plateform after 2015. The current usage metrics is available 48-96 hours after online publication and is updated daily on week days.
Initial download of the metrics may take a while.