Fig. 4
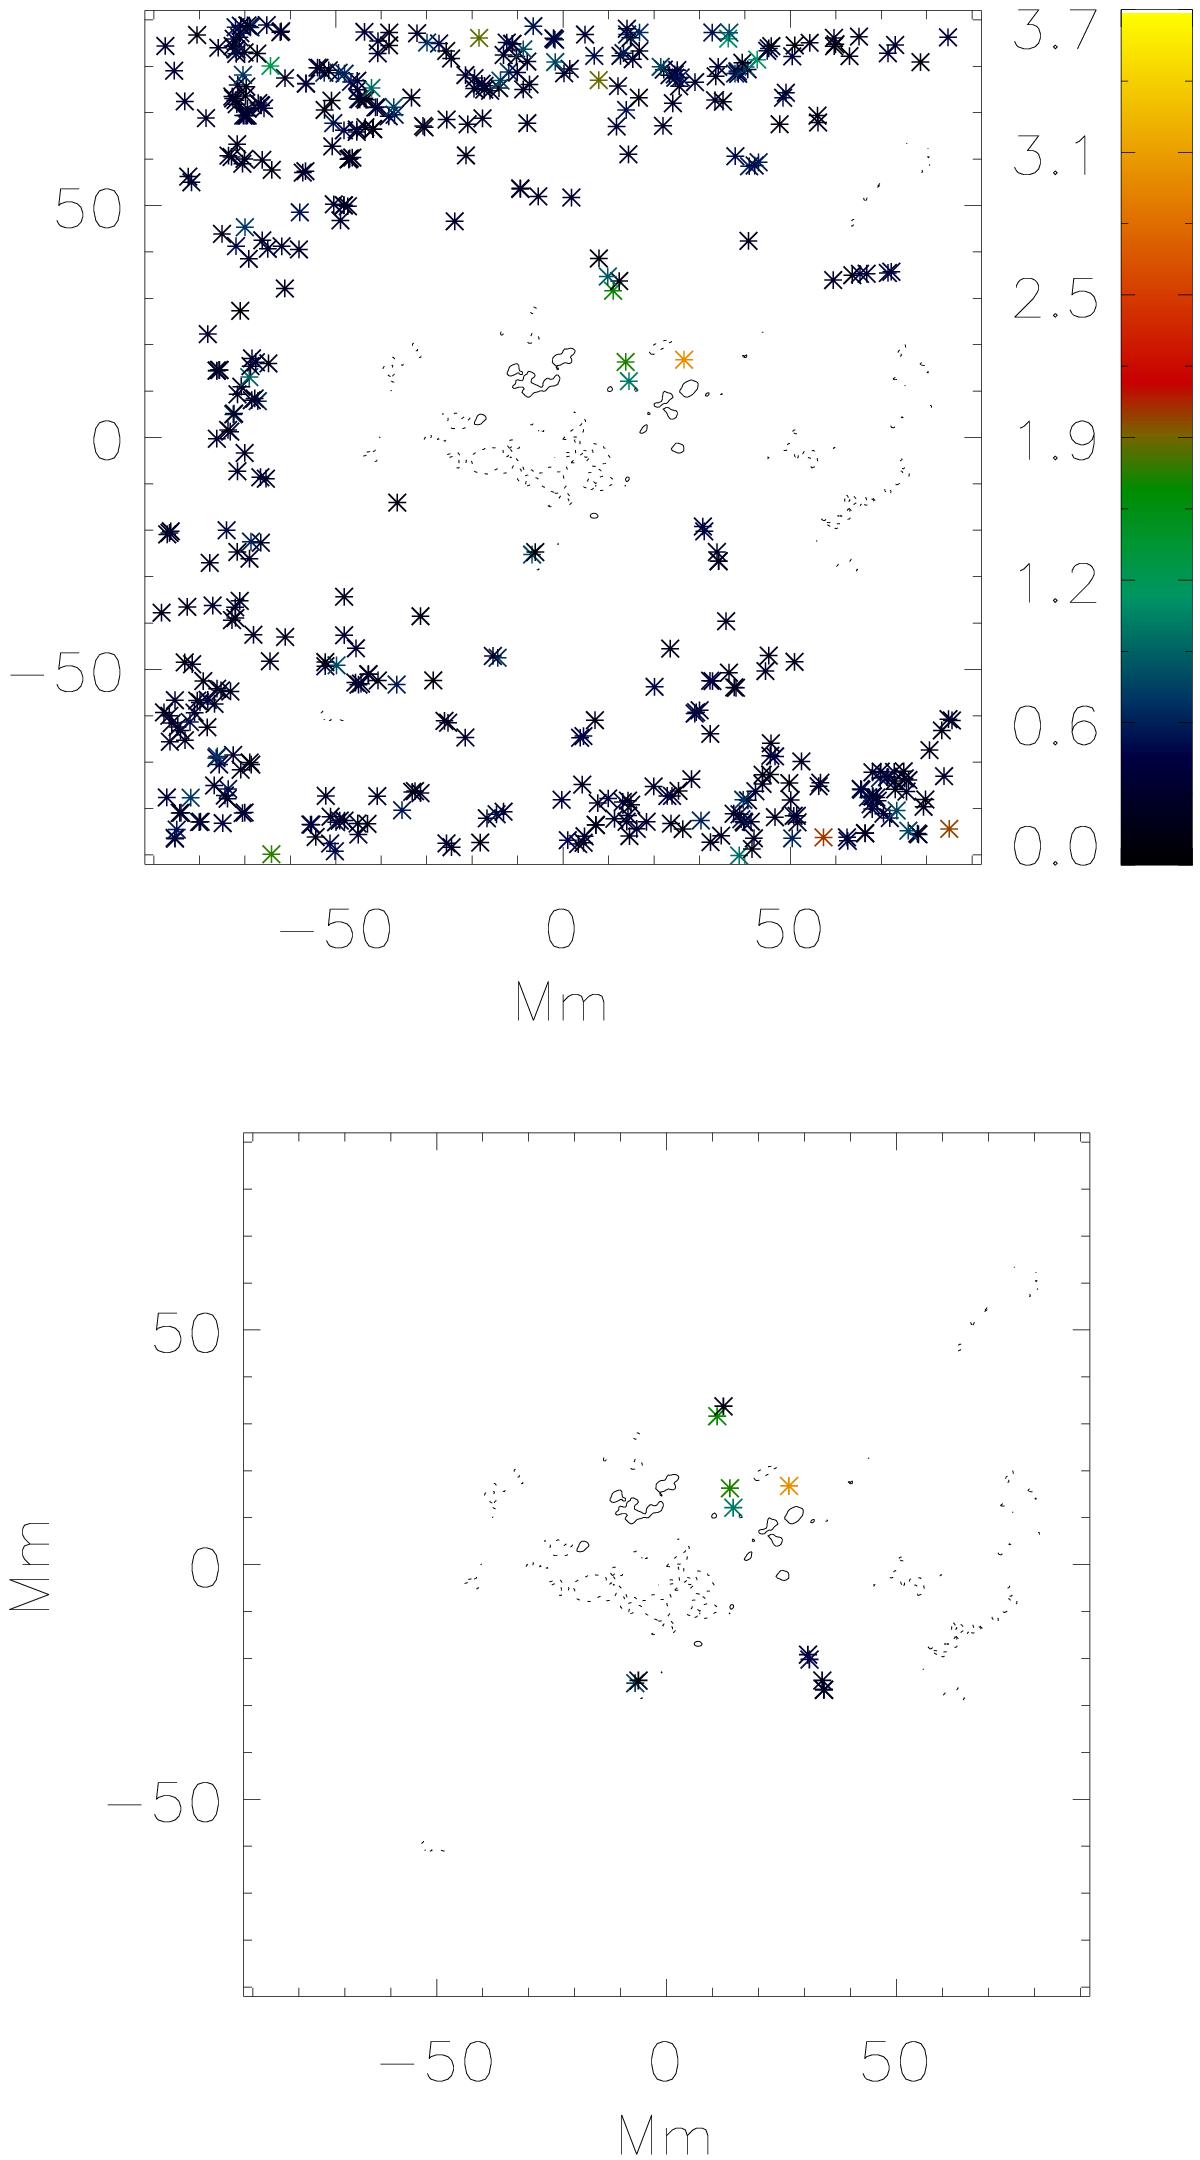
Horizontal positions of the null points in the initial potential magnetic field relative to the frame centre. The colour coding of the points indicate the heights of the nulls points. The square-root of the height is shown to compress the scale. The contour lines (full and dashed) show the locations of the strong magnetic flux concentrations (±500 G). Top: 74 null points above 0.54 Mm. Bottom: the 13 central null points listed in Table 2.
Current usage metrics show cumulative count of Article Views (full-text article views including HTML views, PDF and ePub downloads, according to the available data) and Abstracts Views on Vision4Press platform.
Data correspond to usage on the plateform after 2015. The current usage metrics is available 48-96 hours after online publication and is updated daily on week days.
Initial download of the metrics may take a while.