Free Access
Fig. 13
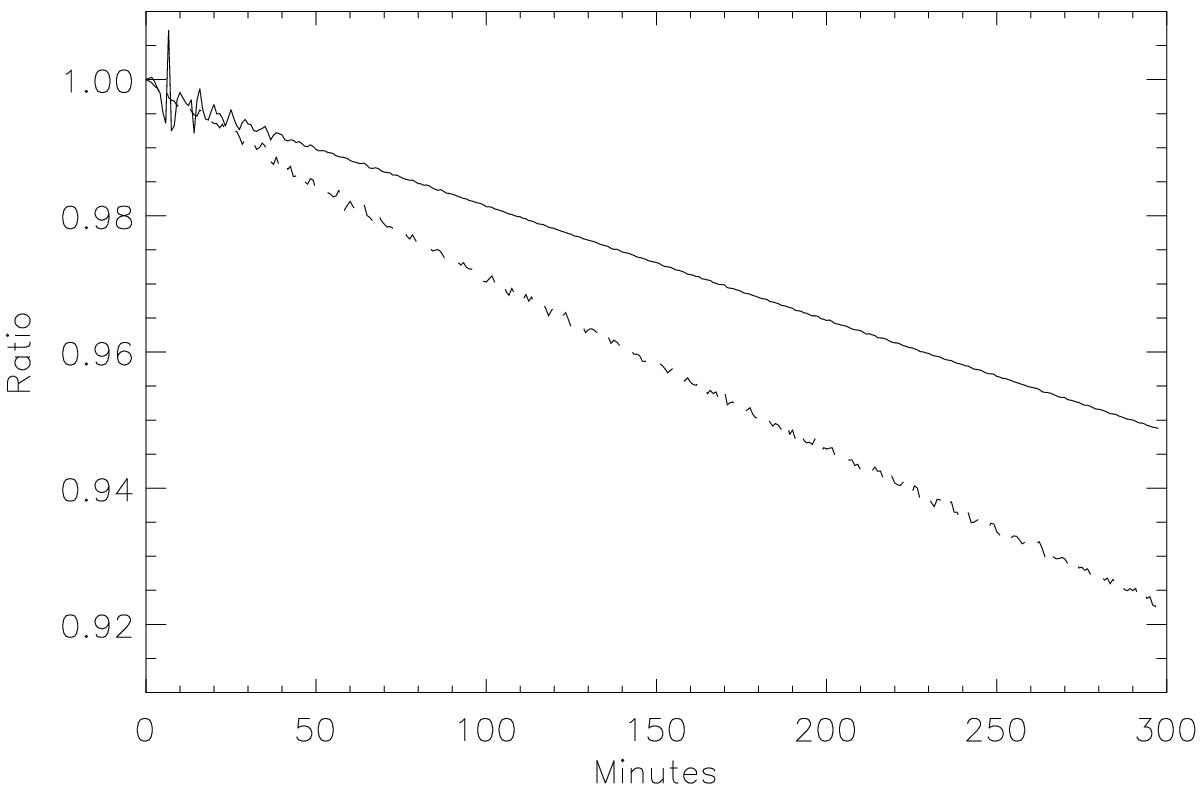
Time variation of the density of a plane at a constant height in the corona – data from different heights in the corona show the same time evolution. The full line represents experiment Exp-1, and the dashed line Exp-2.
Current usage metrics show cumulative count of Article Views (full-text article views including HTML views, PDF and ePub downloads, according to the available data) and Abstracts Views on Vision4Press platform.
Data correspond to usage on the plateform after 2015. The current usage metrics is available 48-96 hours after online publication and is updated daily on week days.
Initial download of the metrics may take a while.