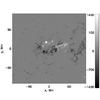
Fig. 1
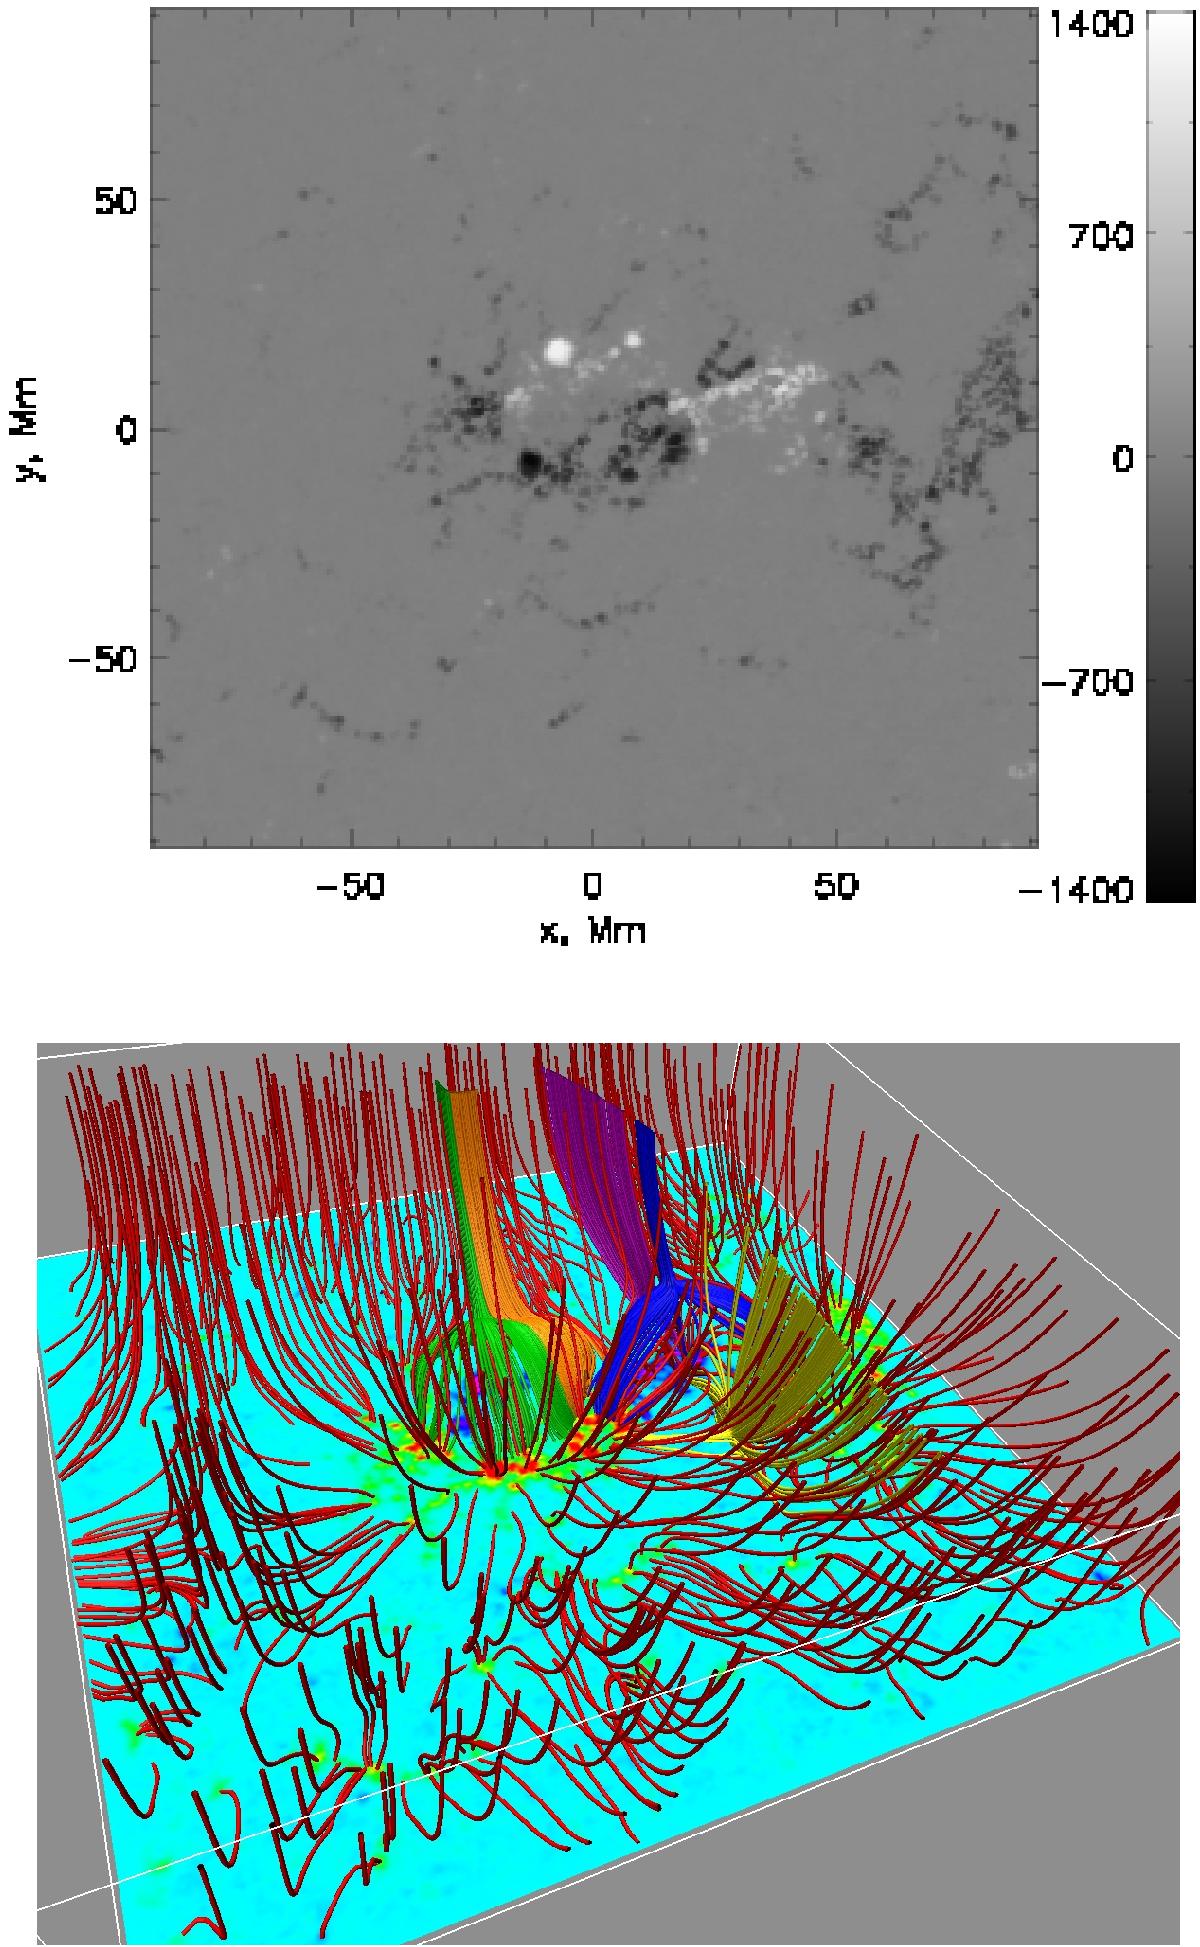
Top: initial HMI magnetogram used to derive the potential magnetic field. The dynamic range is ±1400 G. Bottom: 3D field line structure of the closed region areas with field lines traces from the vicinity of the dominating null points (green, orange, red, blue and yellow). These are combined with field lines of the “open” field (red) region located around the active region. The orientation is rotated slightly relative to the magnetogram, with the left, right and up down edges being the same in the two representations. The size of the magnetogram is 256′′×256′′.
Current usage metrics show cumulative count of Article Views (full-text article views including HTML views, PDF and ePub downloads, according to the available data) and Abstracts Views on Vision4Press platform.
Data correspond to usage on the plateform after 2015. The current usage metrics is available 48-96 hours after online publication and is updated daily on week days.
Initial download of the metrics may take a while.