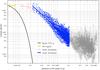
Fig. 6
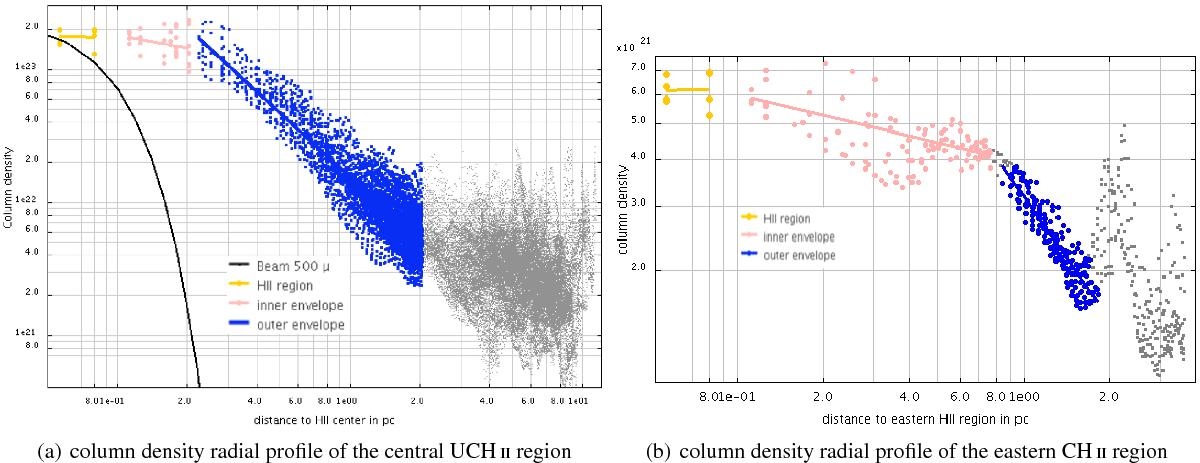
H ii region bubble (yellow line and points) surrounded by a neutral gas envelope splitting into slowly and sharply decreasing NH2 parts (pink and blue lines and points). The background is defined by the lower limit of the clouds of grey points. The resolution corresponding to the Herschel beam at 500 μm is illustrated by the black curve in a).
Current usage metrics show cumulative count of Article Views (full-text article views including HTML views, PDF and ePub downloads, according to the available data) and Abstracts Views on Vision4Press platform.
Data correspond to usage on the plateform after 2015. The current usage metrics is available 48-96 hours after online publication and is updated daily on week days.
Initial download of the metrics may take a while.