Fig. 5
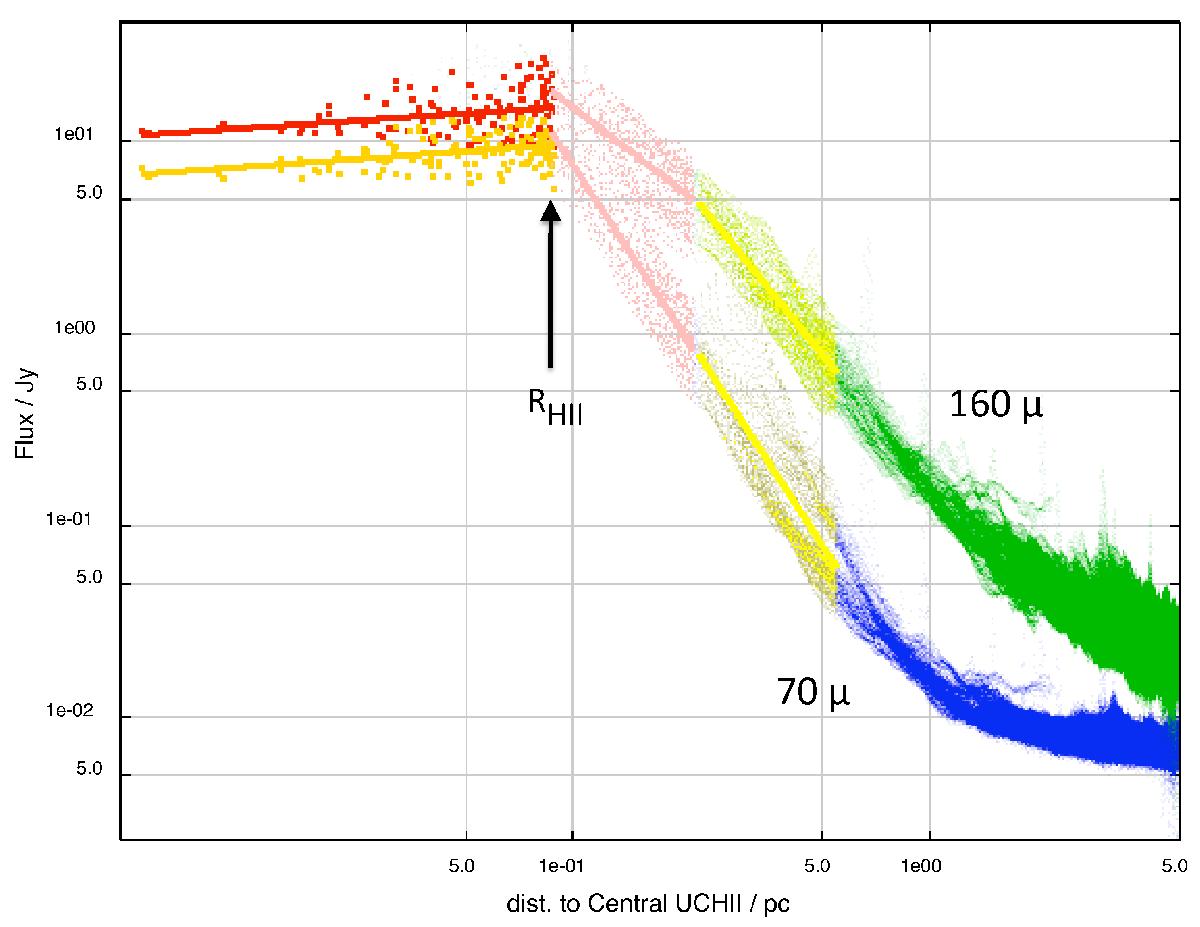
Radial intensity profiles of the central UCH ii region showing the measurements done at 70 μm (blue points) and 160 μm (green points) taking advantage of the PACS highest resolution, compared with the 3-band temperature (T3B) and the 4-band temperature (T4B) data given by the black arrow. The 160 μm profile decreases less in the inner part of the envelope (pink line) than in its outer part (yellow line). Since 160 μm emission is sensitive to dust temperature and density, this behaviour is probably related to the two different slopes found for the density profile of the envelope characterised in Sect. 3.4.1. The slope change indeed occurs at similar RInfall radius.
Current usage metrics show cumulative count of Article Views (full-text article views including HTML views, PDF and ePub downloads, according to the available data) and Abstracts Views on Vision4Press platform.
Data correspond to usage on the plateform after 2015. The current usage metrics is available 48-96 hours after online publication and is updated daily on week days.
Initial download of the metrics may take a while.