Free Access
Fig. 4
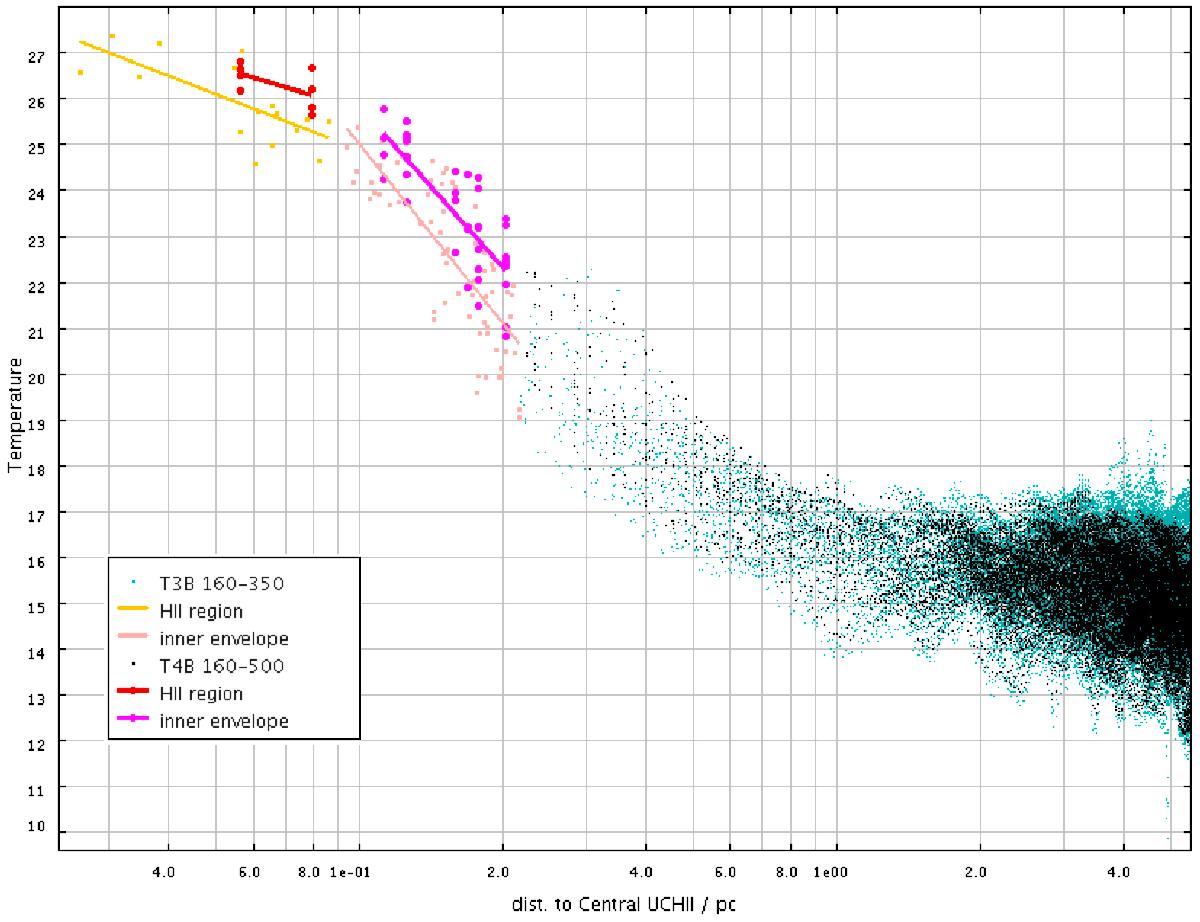
Dust temperature radial profiles of the central UCH ii region showing a steep outer part and a flatter inner region. We note the agreement of the measurements done with the 3-band temperature map, T3B (red and magenta lines and points), and with the 4-band temperature map, T4B (yellow and pink lines and points).
Current usage metrics show cumulative count of Article Views (full-text article views including HTML views, PDF and ePub downloads, according to the available data) and Abstracts Views on Vision4Press platform.
Data correspond to usage on the plateform after 2015. The current usage metrics is available 48-96 hours after online publication and is updated daily on week days.
Initial download of the metrics may take a while.