Fig. 2
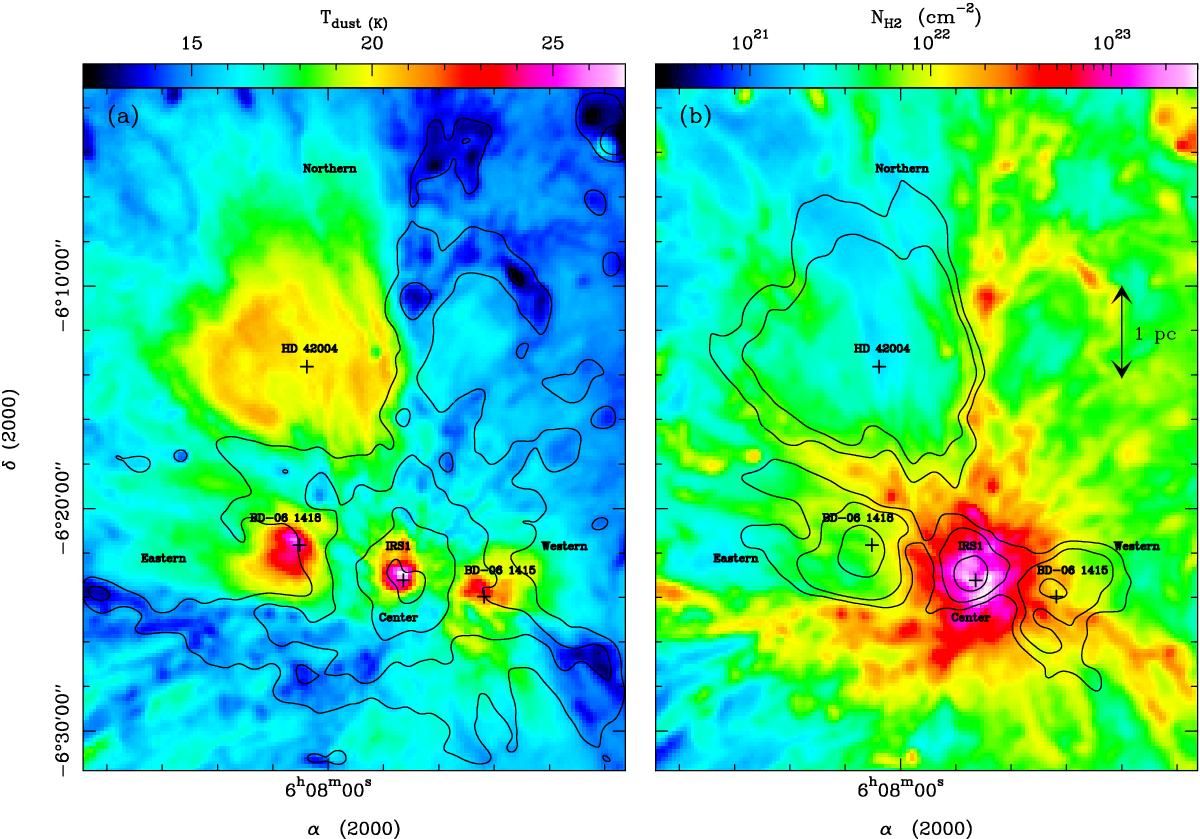
Dust temperature (colours in a) and contours in b)) and column density (colours in b) and contours in a)) maps of the central part of the Mon R2 molecular cloud complex, covering the central, western, eastern, and northern H ii regions with 36″ resolution. The heating sources of H ii regions are indicated by a cross and with their name taken from Racine (1968) and Downes et al. (1975). Smoothed temperature and column density contours are 17.5, 18.5, and 21.5 K and 7 × 10²¹, 1.5 × 10²², 5 × 10²², and 1.8 × 1023 cm-2.
Current usage metrics show cumulative count of Article Views (full-text article views including HTML views, PDF and ePub downloads, according to the available data) and Abstracts Views on Vision4Press platform.
Data correspond to usage on the plateform after 2015. The current usage metrics is available 48-96 hours after online publication and is updated daily on week days.
Initial download of the metrics may take a while.