Fig. D.1
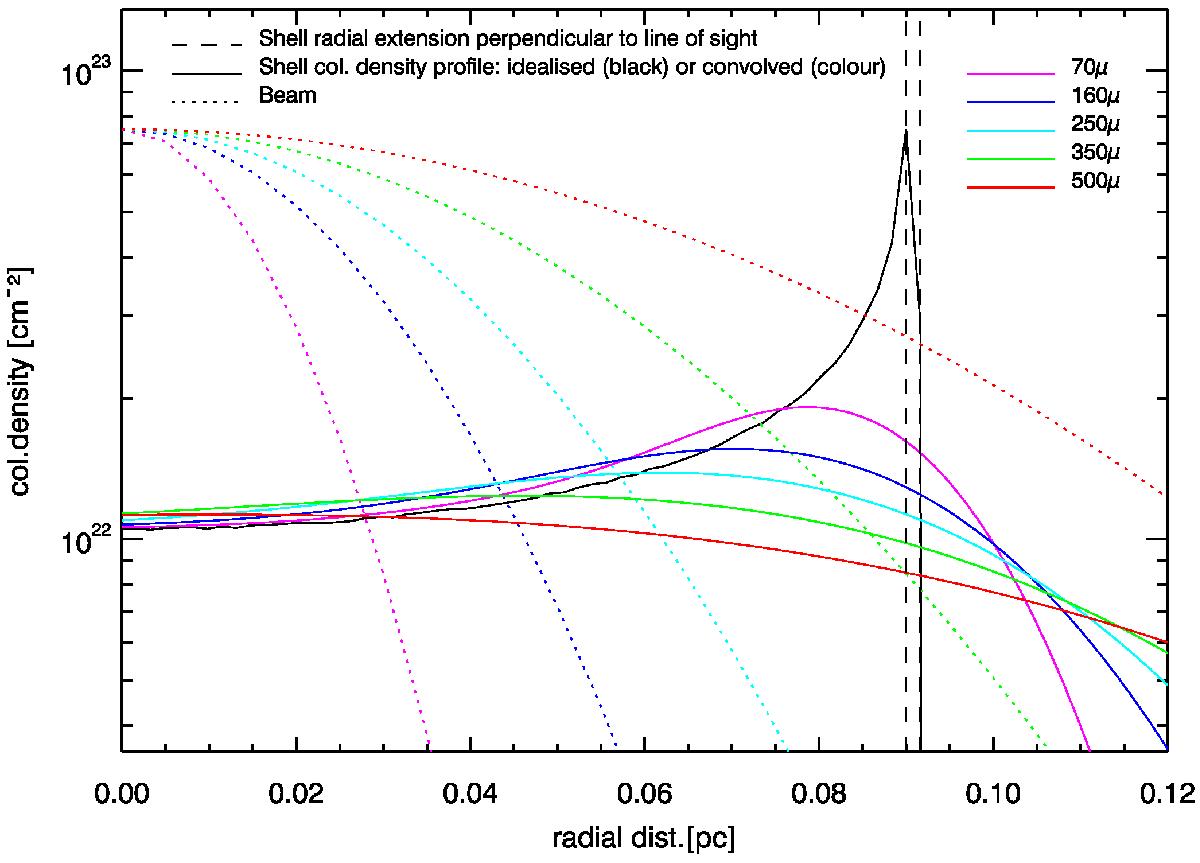
Contribution of the shell to the column density profile of the central UCH ii region. Its density radial extension is given by the two dashed black lines. The column density resulting from the line-of-sight accumulation is illustrated by the black solid line. The shell column density is then convolved with the Herschel beams (coloured dotted lines) to simulate the flux or column density of the shell (coloured solid lines) observable from 6″ (70 μm) to 36″ (500 μm) resolutions.
Current usage metrics show cumulative count of Article Views (full-text article views including HTML views, PDF and ePub downloads, according to the available data) and Abstracts Views on Vision4Press platform.
Data correspond to usage on the plateform after 2015. The current usage metrics is available 48-96 hours after online publication and is updated daily on week days.
Initial download of the metrics may take a while.