Fig. 11
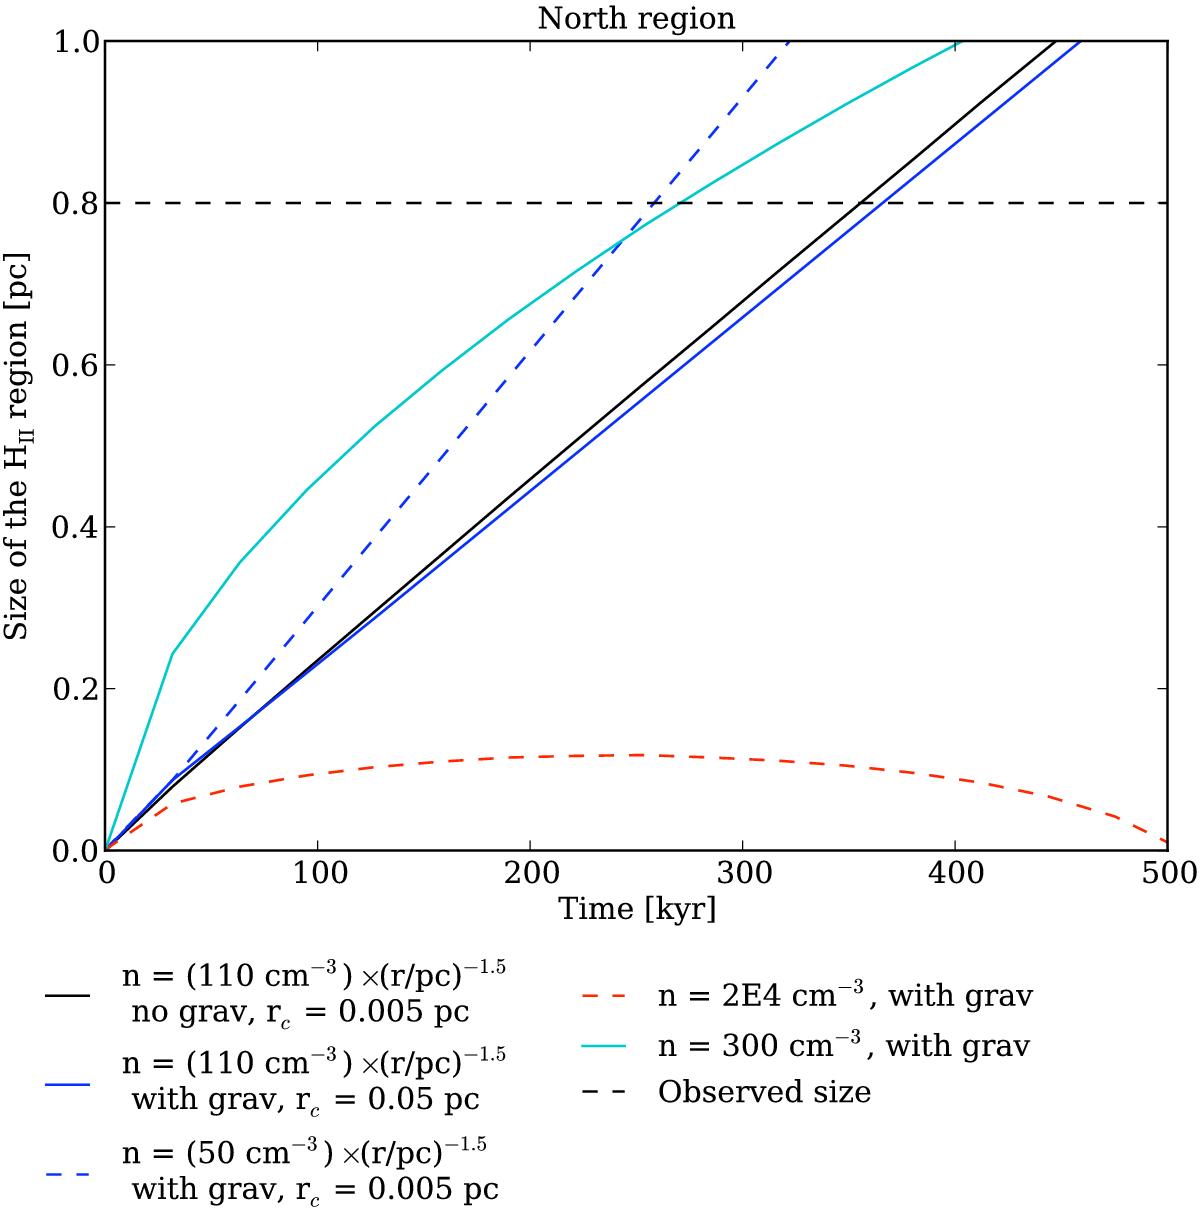
Numerical simulations for the northern H ii region. Simulations with and without gravity are in colours and black, respectively. Continuous lines correspond to simulations with similar average initial density, ⟨ ρinitial ⟩ = 300 cm-3. The envelope has a decreasing power-law density with the characteristics of the observed one and extrapolated to a constant core of radius 0.005 pc (black) and 0.05 pc (dark blue). For the blue dashed line, the envelope has a power law decreasing density with an index corresponding to the observed gradient but with a 50 cm-3 density at 1 pc extrapolated to a constant core at 0.005 pc. For the cyan and red dashed curve, the envelope has a constant density of 300 cm-3 (cyan), corresponding to the average initial density, or a higher 2 × 104 cm-3 density (red dashed), leading to re-collapse.
Current usage metrics show cumulative count of Article Views (full-text article views including HTML views, PDF and ePub downloads, according to the available data) and Abstracts Views on Vision4Press platform.
Data correspond to usage on the plateform after 2015. The current usage metrics is available 48-96 hours after online publication and is updated daily on week days.
Initial download of the metrics may take a while.