Fig. 1
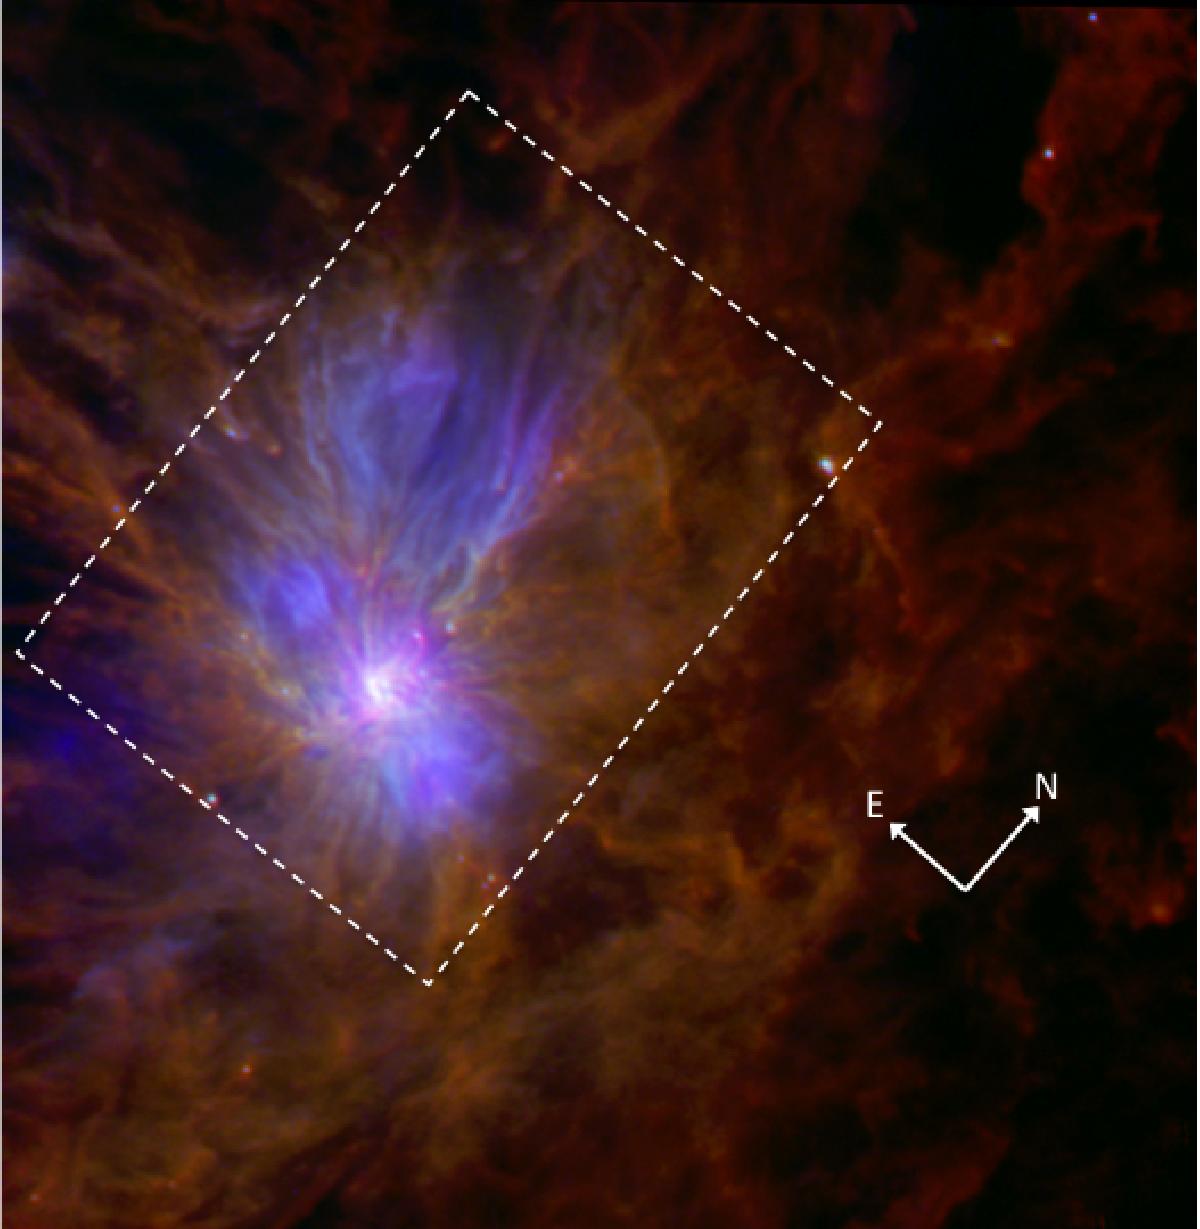
Three-colour Herschel image of the Mon R2 molecular complex using 70 μm (blue), 160 μm (green), and 250 μm (red) maps. The shortest wavelength (blue) reveals the hot dust associated with H ii regions and protostars. The longest wavelength (red) shows the cold, dense cloud structures, displaying a filament network. The dashed rectangle locates the four H ii region area shown in Fig. 2.
Current usage metrics show cumulative count of Article Views (full-text article views including HTML views, PDF and ePub downloads, according to the available data) and Abstracts Views on Vision4Press platform.
Data correspond to usage on the plateform after 2015. The current usage metrics is available 48-96 hours after online publication and is updated daily on week days.
Initial download of the metrics may take a while.